In-View Python Scripting Console in Plexus Connect
This documentation aims to provide users with a clear understanding of the Python scripting Console capabilities within Plexus Connect, illustrating how they can leverage this new tool to enhance data management and analysis processes. Practical examples are included.
Introduction
Plexus Connect offers many functionalities to facilitate daily workflows, though they may be unknown to regular users. Some of these features might initially appear too complex and discourage users from using them at all. A good example of such feature is Python scripting, a powerful tool for data manipulation and analysis. Recognizing that previous requirements for setting up Python scripting could be a barrier, we've streamlined the process with the introduction of an integrated Python scripting console.
This built-in console eliminates the preliminary setup complexities, making Python scripting straightforward and directly accessible alongside your dataset. It's designed to simplify the scripting process, making it accessible even to users with minimal Python knowledge. Here’s a brief overview of what can be achieved with Python scripting built-in console in Plexus Connect:
- Custom Visualizations: Create customized charts and graphs using libraries like Matplotlib and Plotly, enabling enhanced data presentation.
- Automation: Automate repetitive tasks, such as data search, data exports and periodic analyses, to improve efficiency and accuracy.
- Custom Tools: Develop your own functions and tools that expand Plexus Connect’s capabilities, tailored to your specific needs.
- Data Cleaning: Utilize scripts to automate the cleaning process, including removing duplicates, filtering data, and managing missing values, ensuring your datasets remain pristine.
- Collaboration: Facilitate script sharing among team members to foster collaboration and standardize methodologies for handling data.
Requirements and Setup
* Python scripting console is available directly in the UI only in Plexus Connect version 23.16.0 or higher.
* Python version 3.7 or higher installed on your computer. Python installation is described for example here in our documentation. This installation is necessary to run any python script on your computer.
* Connect API containing Plexus Connect Python library, downloadable on our website. Connect API installation is described here in our documentation. This installation integrates Python into Plexus Connect and enables to run scripts directly in Plexus Connect. Connect API package also contains folder with exemplary scripts, which can be modified or used as templates.
Examples of Usage
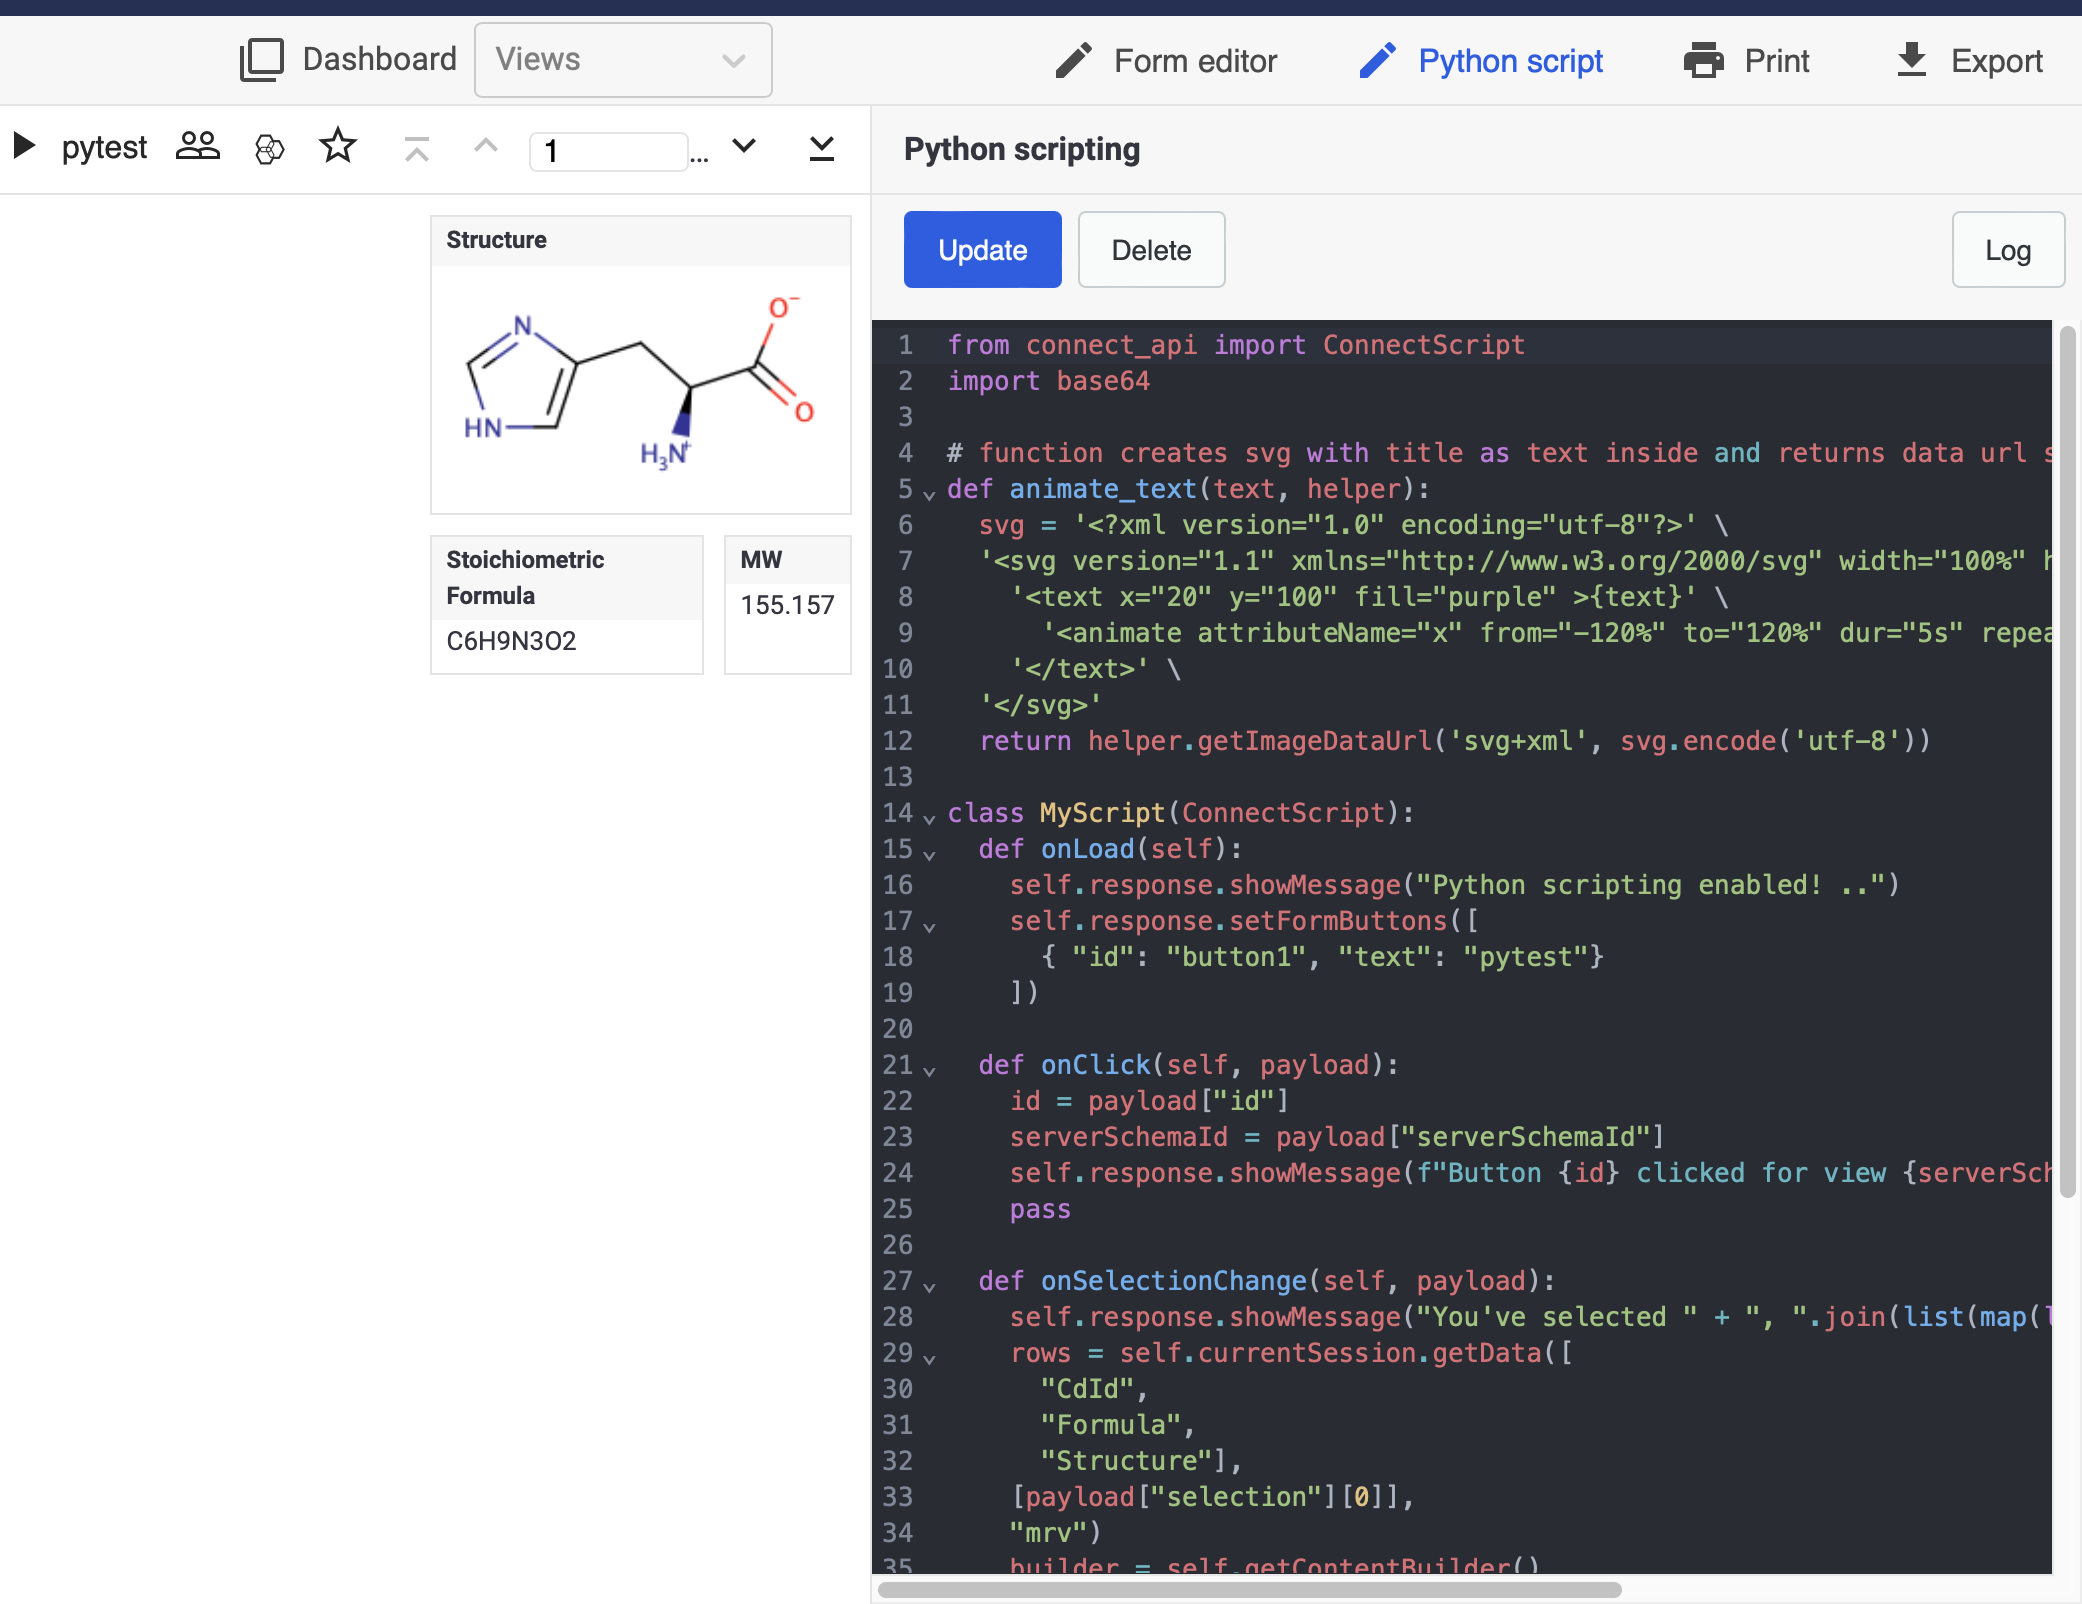
Once the requirements are satisfied, the Python scripting console is ready to use. To access the console, navigate to Python Script tab in the upper right corner of any open view (see the screenshot above).
Example 1: Sample Script
Upon opening the console, you'll find a preloaded sample script. This script is there to show you what a basic Python script looks like. It includes three important methods you can use in Plexus Connect: OnLoad, OnClick, and OnSelectionChange. Each method triggers a different event. For example, in our initial script, every method causes a specific message to pop up (look at lines 15 to 19, 21 to 25, and 27 to 35 in the script). To get the script working, just hit Save and refresh your view.
In general, methods define what will happen when certain action is taken.
OnLoadmethod is activated when new data is loaded. In the sample script, message "Python scripting enabled!.." appears.
OnClickmethod is activated upon clicking on some object in the View. In the sample script, message "Button button1 clicked for view"
OnSelectionChangemethod is activated upon browsing thru your data set. In the sample script, message "You've selected"
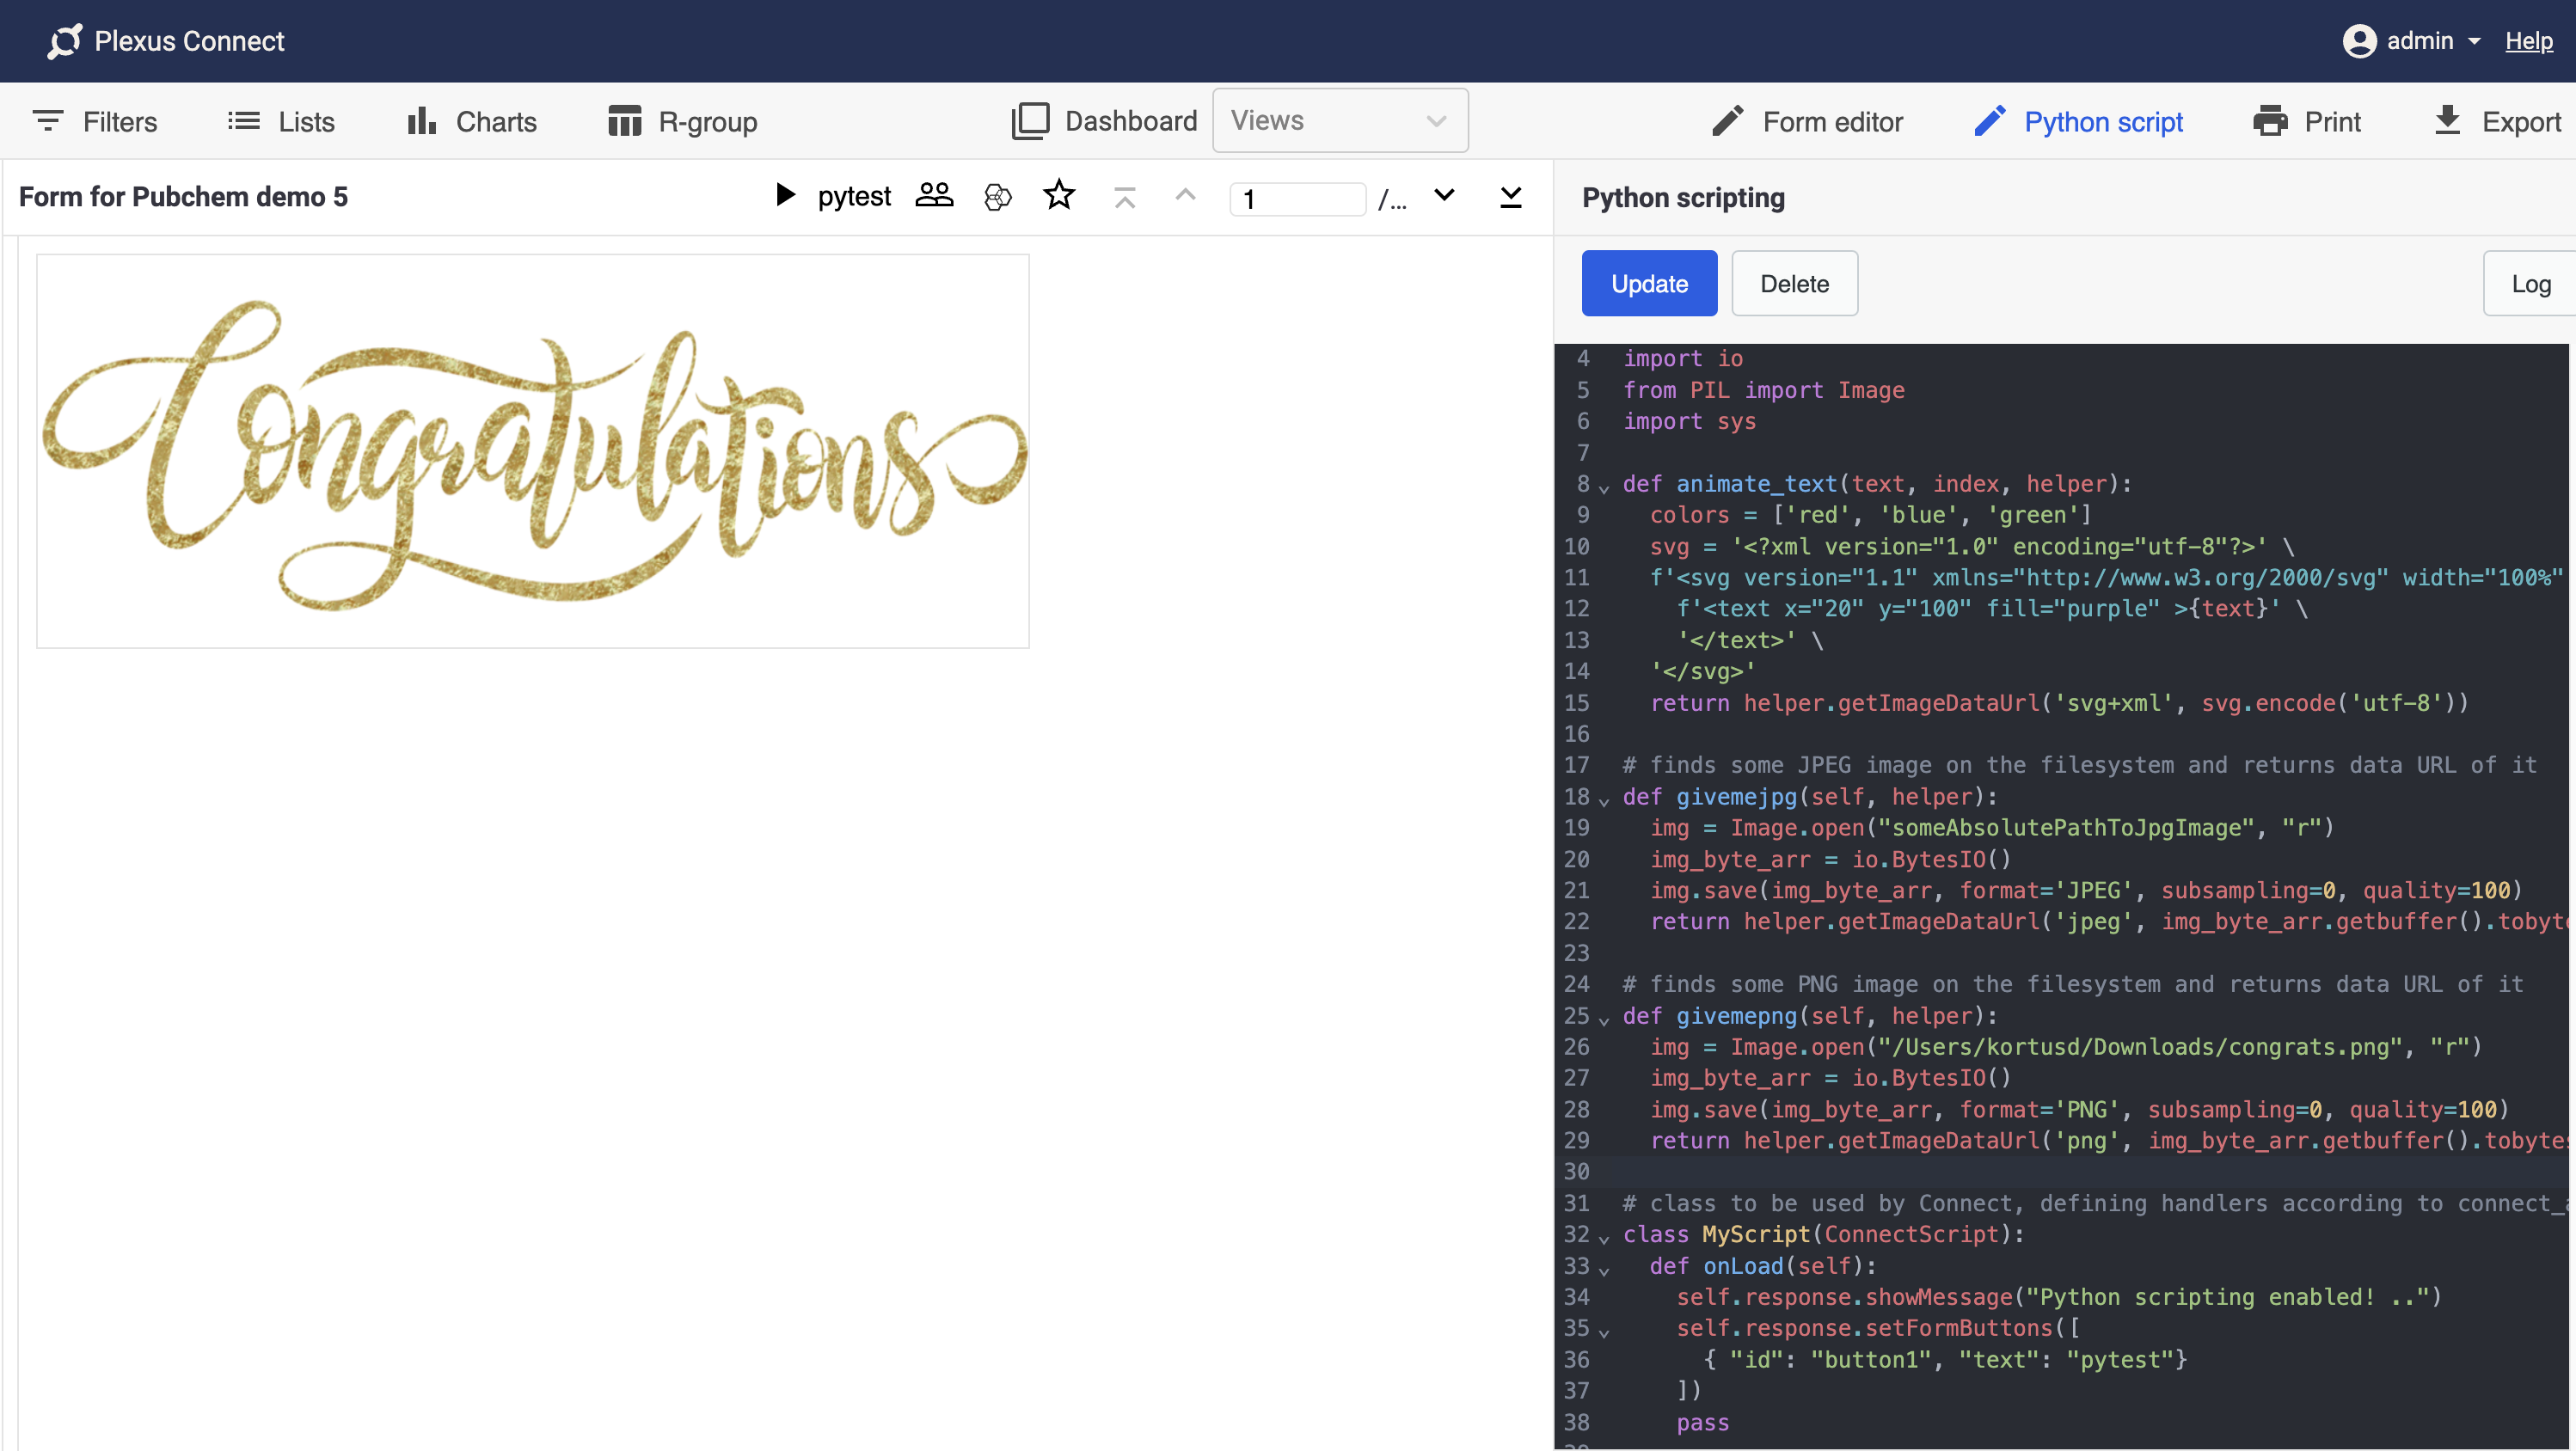
Example 2: Adding Static Graphical Object to a View
To further extend python versatility, so-called libraries often have to be installed. In this example, we will install pillow library that adds image processing capabilities and supports all typical image formats (jpg, jpeg, png, svg, etc.).
To install pillow library, open command line (Terminal on Mac) and write pip3 install pillow. The installation takes few second.
The following script allows to display an image in either jpeg or png format located on your computer. In order to display the image, add Canvas Widget to your form view (preferably, there should be only one canvas widget). Then, copy paste the script to the in-view python console and replace "someAbsolutePathToJpgImage" in jpeg or "someAbsolutePathToJpgImage" in png section of the script with absolute path pointing to your image. Hit save and reload the view. The Canvas widget should be occupied by the image.
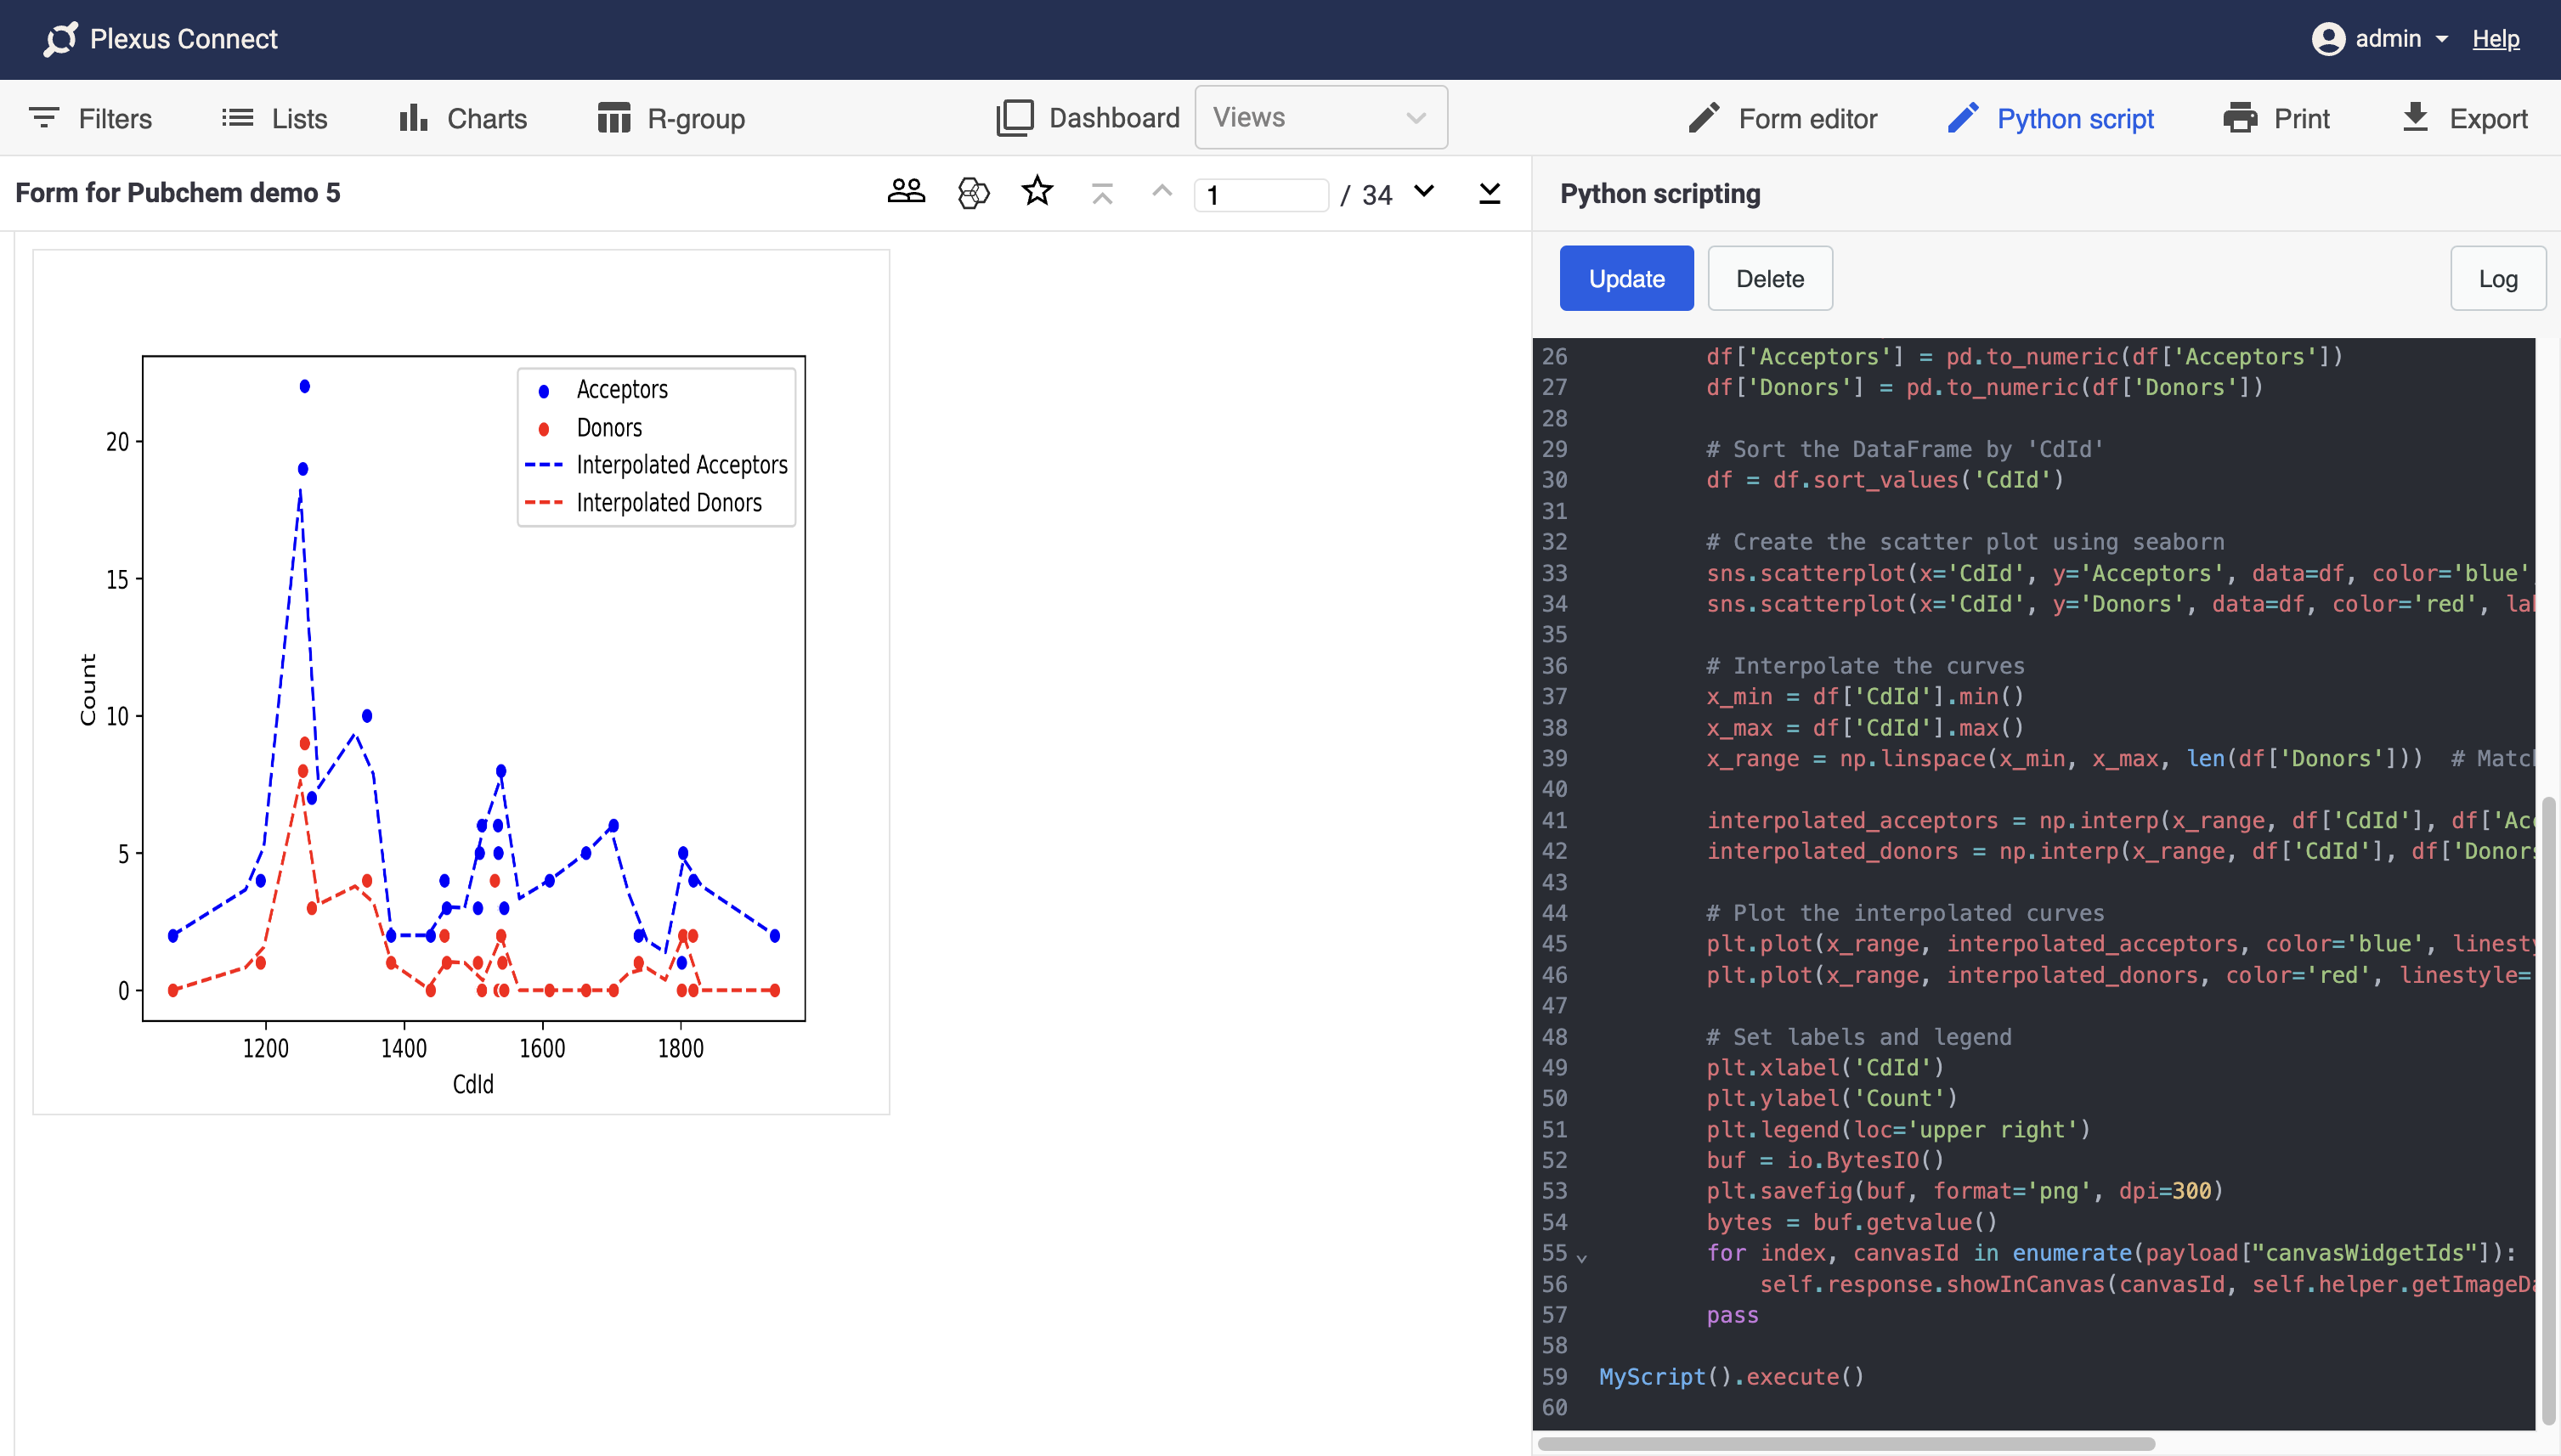
Example 3: Adding Dynamic Graphical Object to a View
The following script creates chart from current dataset. If the dataset is changed (filtering data, etc.) the chart is updated accordingly. OnDataLoad method used in this script updates the chart every time new data is displayed.
Both x and y variables (fields) are specified in the script. In order to display the chart, add Canvas Widget to your form view (preferably, there should be only one canvas widget). Then, copy paste the script to the in-view python console, hit save and reload the view. The Canvas widget should be occupied by the chart.
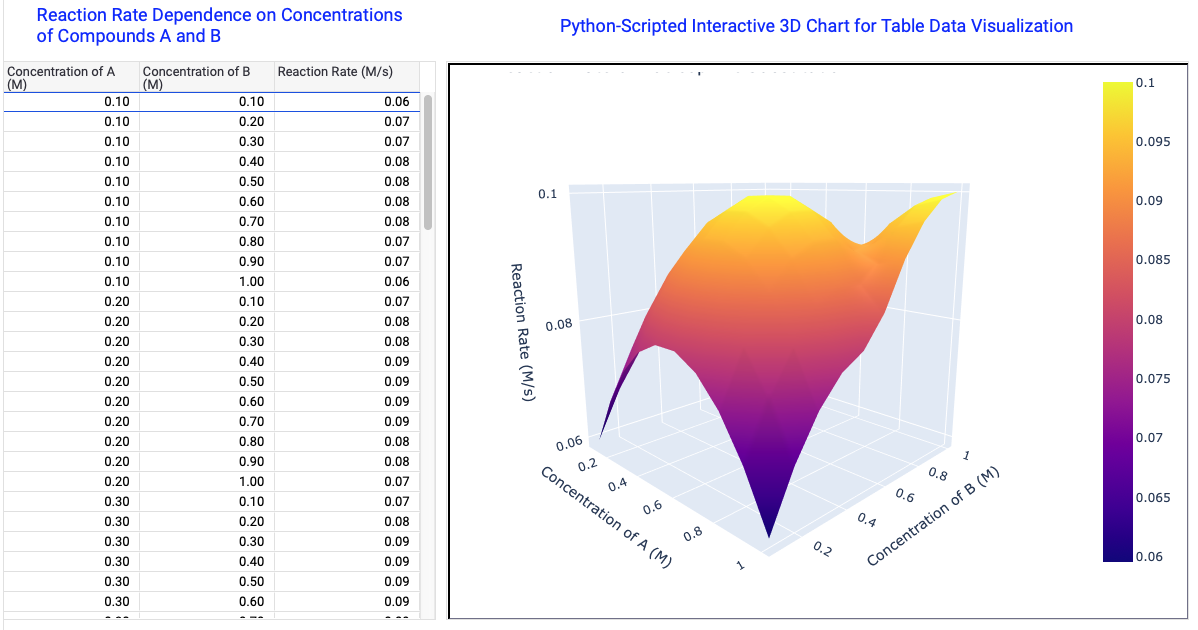
Example 4: Adding Interactive 3D Chart
The following Python script is designed for visualizing the relationship between two variables and an outcome in experimental data, such as reactant concentrations and reaction rates in chemistry. It automatically pulls data from chosen fields and displays it into a 3D surface plot. The interactive plot helps Plexus Connect users analyze trends and optimize conditions for various types of experiments or datasets.
Should you require a solution precisely tailored to your specific needs, the Instant JChem support team is ready to assist. Contact us via Chemaxon Freshdesk for custom-designed scripts.