logD Plugin
This manual guides you through Chemaxon's logD Plugin.
Introduction
Compounds with ionisable groups are present in solution as an equilibrium of different microspecies. The extent of ionisation of those groups and the ratio of their microspecies depend on the pH of the solution.
Since logP describes the lipophilic-hydrophilic behaviour of the neutral form of the molecule, it does not take the effect of ionisation into account. LogD does and it is the octanol-water coefficient of a compound at a given pH.
You can find more information about the definition and derivation of logP/logD here.
Options
The logD Plugin has the following options.
General Options
The following prediction options can be set on the General Options tab of the logD Options window.
logP method
This option is for selecting the applied prediction method. This can be:
- Consensus: this is a consensus model built from the Chemaxon, the Klopman et al. models and the PhysProp database.
- Chemaxon: this is Chemaxon's own logP model, which is an extension of the original VG method (published in Viswanadhan et al.). You can read more about it here.
- User defined: if a library of structures and experimental logP values is available, it can be used as a training set for logP prediction. If this option is selected, the logP training ID dropdown menu lists all available logP training libraries. See this documentation page about generating such training libraries.
Other options
There are other general options for the logD prediction as well.
- Electrolyte concentration: sets the anion and cation concentrations for the prediction.
- Cl- concentration: can be set between 0.1 and 0.25 mol/L.
- Na+/ K+ concentration: can be set between 0.1 and 0.25 mol/L.
- pKa correction library: if a library of structures and experimental pKa values is available, it can be used as a training set for pKa prediction. If this option is selected, the pKa correction library dropdown menu lists all available pKa training libraries. See this documentation page about generating such training libraries.
- Consider tautomerization/resonance: if this option is used, the major tautomer form is taken into account in the logD prediction.
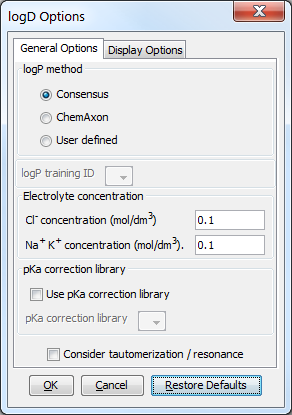
Fig. 1 The General Options tab of the logD Options window
Display Options
The following display options can be set on the Display Options tab of the logD Options panel.
- Decimal places: this sets the number of decimal places of precision for the result value.
- Chart: sets the parameters of the pH axis of the pH-logD curve. These are the lower pH limit, the upper pH limit and the pH step size.
- Reference pH values: sets the reference pH values at which logD is calculated with pre-defined accuracy.
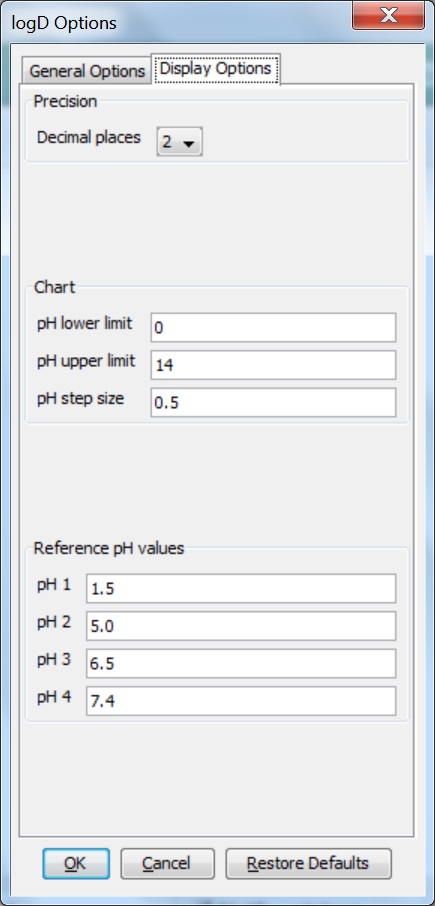
Fig. 2 The Display Options tab of the logD Options window
The result window
The result window shows the pH-logD curves of the input molecules. The numbered images of the molecules are shown in the legend. The reference pH-logD values and the full pH-logD table are also shown.
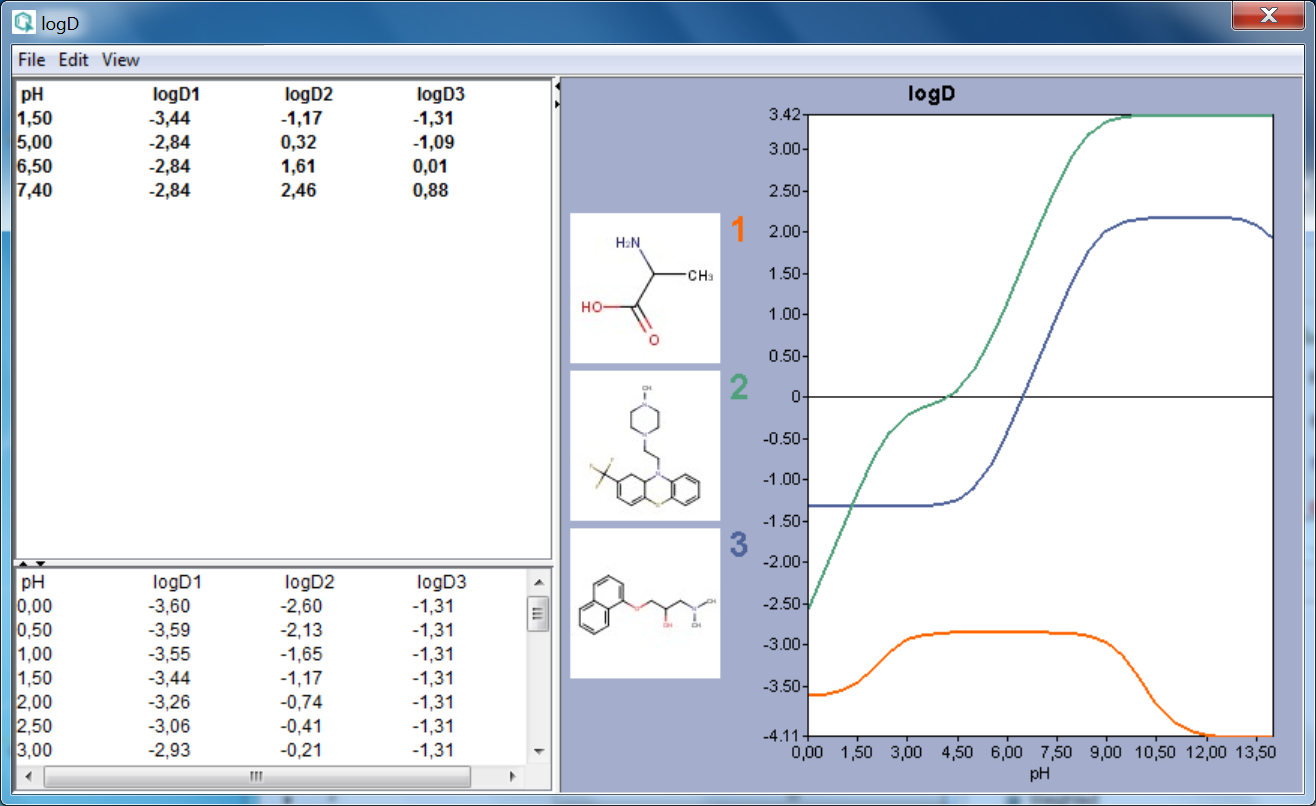
Fig. 3 The logD result window showing the pH-logD curves of three molecules
References
-
Viswanadhan, V. N.; Ghose, A. K.; Revankar, G. R.; Robins, R. K., J. Chem. Inf. Comput. Sci. , 1989 , 29 , 163-172; doi
-
Klopman, G.; Li, Ju-Yun.; Wang, S.; Dimayuga, M.: J.Chem.Inf.Comput.Sci. , 1994 , 34 , 752; doi
-
PHYSPROP© database
-
Csizmadia, F; Tsantili-Kakoulidou, A.; Pander, I.; Darvas, F., J. Pharm. Sci. , 1997 , 86 , 865-871; doi