Problems with the application performance
Thread dump
Thread dump is a textual dump of all the active threads and monitors of the Java applications running in a Virtual Machine. It is very useful source of information for debug, which shows us the runtime snapshot of IJC. Please proceed according to the instruction manual below. We describe here few ways how to get thread dump. Your choice depends on whether IJC freezes completely or if the user interface is still accessible.
IJC is completely frozen (deadlock)
It is not possible to control the application at all. Buttons doesn't respond to clicks and it is not possible to browse menu or exit the application normally. In this case we'd need a complete thread dump. This can be done using a few tools which are distributed with JDK and thus Java Development Kit must be installed on the computer. This approach is particularly useful when IJC is working on some task suspiciously long, IJC takes significant CPU time (up to 100% sometimes) and the task normally finishes quickly, but this time (on this specific data for example) it's not finishing. Then this approach should be used.
Tools jps & jstack
Latest JDK version can be found at Oracle:
-
Install JDK.
-
Start IJC, start connecting to schema, let it go frozen.
-
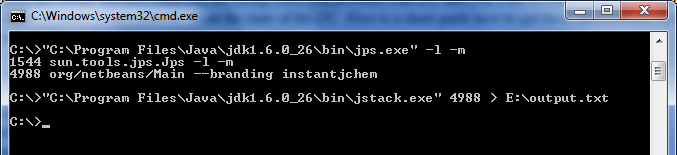
Use this command from installed JDK (it prints current java processes):
bin\jps.exe -l -m
-
The output can look for example:
C:>c:\jdk16\bin\jps -l -m
2440 sun.tools.jps -l -m
4828
The second number is IJC.
-
Use the other JDK tool:
bin\jstack 4828
=> it prints all current threads (what IJC is exactly doing).
- Please send us the output.
IJC is not completely frozen
Something is still running and you can control IJC. The output from tools mentioned above could help us as well, but in this case you can use this:
-
In IJC r-click to toolbar.
-
Switch on the memory toolbar.
-
There will be a memory info chart + new button in toolbar. Use that button ("Take snapshot of thread dump...").
-
Press it once and then after 1 minute press it second time
=> Please send us the file it generates.

JVM crashes completely
When a fatal error occurs the application crashes completely together with the Java Virtual Machine. In this case an error log is created with information and the state obtained at the time of the fatal error. This file has name hs_err_pid pid .log, where pid is the process ID of the process. Primarily this file will be found in the IJC working directory (eg. C:\Program Files\Chemaxon\InstantJChem ). In the event that the file cannot be created in the working directory (insufficient space, permission problem, or other issue), the file is created in the temporary directory for the operating system (on Windows it is usually C:\Users userName \AppData\Local\Temp ). If you can not find the file search for "hs_err_pid*.log", but file is only created when a fatal error occures and JVM crashes.
OutOfMemory error
This error occurs when some procedure requires more memory than the maximum Java heap size memory. It can happen when there is a bug in IJC or when your maximum memory size is too small. Sometimes helps to increase the maximum memory settings. To do this go to Tools -> Options -> Miscellaneous -> Other settings and increase the Maximum memory size. When an OutOfMemory error occurs Java heap diagnostics is written to the dump file. The dump file has the following location: userDir \var\log\heapdump.hprof. This location on Windows can be somewhat like C:\Users userName \AppData\Roaming\.instantjchem ijcVersion \var\log\heapdump.hprof.