Obtaining performance log
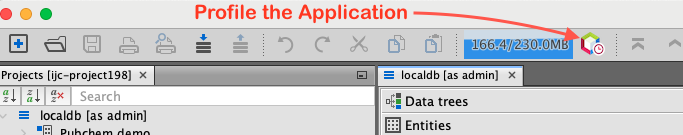
By using Application Profile functionallity, it is possible to obtain detailed perfomance log snapshot in IJC. Click on "View" and in drop down menu under "Toolbars" select "Perfomance". Memory monitoring and Profile the Application icon will appear in IJC toolbar.
To begin monitoring, click Profile the Application icon. Then, perform any action within IJC such as querying or opening views. After completing these actions, click Profile the Application icon again to stop monitoring.
A binary file will be generated, and two dialog boxes will appear. Click OK on the first dialog and Yes on the second to open the file in IJC. To find the location of the binary file, hover your cursor over the binary file name in Views tab.