- Standalone Applications
- BioEddie
- ChemAxon Assay
- ChemCurator
- ChemLocator
- cHemTS
- Compliance Checker
- Compound Registration
- Quick Start Guide
- Compound Registration User's Guide
- Overview
- Compound Registration Abbreviations
- Definitions of Terms
- Compound Registration Introduction
- Login
- Dashboard page
- Autoregistration
- Bulk Upload
- Advanced Registration
- Search
- User Profile
- Download
- Browse page
- Appendix A. Calculations
- Appendix B. Markush Structures
- Multi-Component compounds
- Restricted compounds
- Configuration Guide
- Deployment Guide
- Compound Registration FAQ
- Compound Registration System Requirements
- Compound Registration History of Changes
- API documentation
- Instant JChem
- Instant Jchem User Guide
- Getting Started
- IJC Projects
- IJC Schemas
- Viewing and Managing Data
- Lists and Queries
- Collaboration
- Import and Export
- Editing Databases
- Relational Data
- Chemical Calculations and Predictions
- Chemistry Functions
- Security
- Scripting
- Updating Instant JChem
- Tips and Tricks
- Instant JChem Tutorials
- Building a relational form from scratch
- Building more complex relational data models
- Defining a security policy
- Filtering items using roles
- Lists and Queries management
- Query building tutorial
- Reaction enumeration analysis and visualization
- SD file import basic visualization and overlap analysis
- Using Import map and merge
- Using Standardizer to your advantage
- Pivoting tutorial
- Instant JChem Administrator Guide
- Admin Tool
- IJC Deployment Guide
- Supported databases
- JChem Cartridge
- Using Oracle Text in Instant JChem
- Deployment via Java Web Start
- Startup Options
- Shared project configuration
- Accessing data with URLs
- Instant JChem Meta Data Tables
- Test to Production Metadata Migrator
- Filtering Items
- Deploying the IJC OData extension into Spotfire
- Reporting a Problem
- Manual Instant JChem schema admin functions
- SQL Scripts for Manual Schema Upgrade
- Database Row Level Security
- JccWithIJC
- Deploying Spotfire Middle Tier solution
- Instant JChem Developer Guide
- Working With IJC Architecture
- IJC API
- Groovy Scripting
- Good Practices
- Schema and DataTree Scripts
- Simple SDF Exporter
- Relational SDF Exporter
- CDX File Importer
- Data Merger or Inserter from an SDF file
- Markush DCR Structures Exporter
- Select Representative Member of Clusters
- Table Standardizer
- Populate a Table with Microspecies
- Create a Diverse Subset
- Pearson Linear Correlation Co-efficient Calculator
- PDF Trawler
- Simple Substructure Search
- Intersecting Sets
- Find Entries with Duplicated Field Value
- Importing Multiple SDF Files
- Calling External Tools
- Create Relational Data Tree
- Forms Model Scripts
- Button Scripts
- Execute Permanent Query
- Patent Fetcher Button
- Batch Searching Button
- Import or Export a Saved Query SDF Button
- Back and Next Buttons
- Add Annotations Button
- Simple Structure Checker Button
- Advanced Structure Checker Button
- Calculate MolWeight and generate SMILES
- Get Current User
- Simple ChemicalTerms evaluator
- Edit Molecule Button
- TanimotoSimilarityButton
- TanimotoMultiple
- Execute Permanent Query Based On Its Name
- Open existing view in the same dataTree
- Export selection to file
- Generate random resultset from actual resultset
- Form Scripts
- Groovy Scriptlets
- Buttons vs Scripts
- Creating New Entities
- Creating New Fields
- Reading Molecules From a File
- Insert or Update a Row
- Evaluator
- Create or Find a Relationship
- Adding an Edge to a Data Tree
- Exporting Data to a File
- Connect to an External Database
- Create a New ChemTerm Field
- Create a New Dynamic URL Field
- Create a New Static URL Field
- Java Plugins
- IJC Plugin Quick Start
- IJC Hello World Plugin
- IJC Plugin tutorial - MyAddField plugin
- IJC Plugin tutorial - MyMathCalc plugin
- IJC Plugin tutorial - Renderer Example
- IJC Plugin tutorial - MySCServer webapp
- IJC Plugin tutorial - MySCClient plugin
- IJC Plugin tutorial - Canvas widget
- Java Plugins and Java Web Start
- Instant JChem FAQ
- Instant JChem Installation and Upgrade
- New Features
- New Features in IJC Q4 2020
- New Features in IJC Q3 2020
- New Features in IJC Q2 2020
- New Features in IJC Q1 2020
- New Features in IJC Q4 2019
- New Features in IJC Q3 2019
- New Features in IJC Q2 2019
- New Features in IJC Q1 2019
- New Features in IJC Q4 2018
- New Features in IJC Q3 2018
- New Features in IJC Q2 2018
- New Features in IJC Q1 2018
- New Features in IJC Q4 2017
- New Features in IJC Q3 2017
- New Features in IJC Q2 2017
- New Features in IJC Q1 2017
- New Features in IJC Q4 2016
- New Features in IJC Q3 2016
- New Features in IJC Q2 2016
- New Features in IJC Q1 2016
- New Features in IJC Q4 2015
- New Features in IJC Q3 2015
- New Features in IJC Q2 2015
- New Features in IJC Q1 2015
- Instant JChem Licensing
- IJC Getting Help and Support
- Instant JChem System Requirements
- Instant JChem History of Changes
- Instant Jchem User Guide
- Markush Editor
- Design Hub
- History of changes
- Install guide
- Configuration guide
- Plugin Catalogue
- Developer guide - REST API
- Developer guide - resolver plugins
- Developer guide - real time plugins
- Developer guide - real time plugin templates
- Developer guide - export plugins
- Developer guide - storage plugins
- Developer guide - theme customization
- Install guide - Kubernetes
- Marvin Live
- User guide
- History of changes
- Install guide
- Configuration guide
- Plugin Catalogue
- Developer guide - sending data
- Developer guide - resolver plugins
- Developer guide - real time plugins
- Developer guide - export plugins
- Developer guide - theme customization
- Developer guide - storage plugins
- Developer guide - real time plugin templates
- Migration guide
- Cloud deployment
- Marvin Desktop Suite
- MarvinSketch
- User Guide
- Getting Started
- Graphical User Interface
- Working in MarvinSketch
- Structure Display Options
- Basic Editing
- Drawing Simple Structures
- Drawing More Complex Structures
- Drawing Reactions
- Using Integrated Calculations
- Graphical Objects
- Import and Export Options
- Multipage Documents
- Printing
- Chemical Features
- Marvin OLE User Guide
- Appendix
- Tutorials
- Developer Guide
- MarvinSketch Application Options
- User Guide
- MarvinView
- Marvin Desktop Suite Installation and Upgrade
- Marvin Desktop Suite History of Changes
- Marvin Desktop Suite Licensing
- MarvinSketch
- Molconvert
- Plexus Connect
- Plexus Connect - Quick Start Guide
- Plexus Connect - User Guide
- Plexus Connect - Log in
- Plexus Connect - Dashboard
- Plexus Connect - Exporting Your Data
- Plexus Connect - Browsing in Your Data Set
- Plexus Connect - Selecting Data
- Plexus Connect - Searching in Your Database
- Plexus Connect - Saved Queries
- Plexus Connect - List Management
- Plexus Connect - Sorting Data
- Plexus Connect - Sharing Data with Other Users
- Plexus Connect - Charts View
- Plexus Connect - R-group Decomposition
- Plexus Connect - Administrator Guide
- Plexus Connect - Authentication
- Plexus Connect - Sharing Schema Items Among Users
- Plexus Connect - Business Flags
- Plexus Connect - Row-level Security
- Plexus Connect - Shared data sources
- Plexus Connect - Configuration Files
- Plexus Connect - Simple table
- Plexus Connect - Getting the Plexus Backend and Frontend Log Files
- Plexus Connect - Schema Editor
- Plexus Connect - Scripting
- Plexus Connect - Installation and System Requirements
- Plexus Connect - Licensing
- Plexus Connect - Getting Help and Support
- Plexus Connect - FAQ
- Plexus Connect - Privacy Policy
- Plexus Connect - Terms of Use for the Demo Site
- Plexus Connect - History of Changes
- Plexus Connect - Schema Refresh Without Restart
- Zosimos
- Toolkits and Components
- AutoMapper
- Calculator Plugins
- Introduction to Calculator Plugins
- Calculator Plugins User's Guide
- Calculator Plugins Developer's Guide
- Background materials
- Calculation of partial charge distribution
- Generate3D
- Isoelectric point (pI) calculation
- LogP and logD calculations
- NMR model prediction
- pKa calculation
- Red and blue representation of pKa values
- Tautomerization and tautomers
- Validation results
- Tautomerization and tautomer models of ChemAxon
- Theory of aqueous solubility prediction
- The tautomerization models behind the JChem tautomer search
- Calculators performance reports
- Calculator Plugins Licensing
- Calculator Plugins FAQ
- Calculator Plugins Getting Help and Support
- Calculator Plugins History of Changes
- Calculator Plugins System Requirements
- Biomolecule Toolkit
- ChemAxon Synergy
- ChemAxon Synergy User Guide
- ChemAxon Synergy Developer Guide
- ChemAxon Synergy Administrator Guide
- Chemaxon Synergy History of Changes
- Document to Structure
- JChem Base
- JChem Base Administration
- JChem Base Developer's Guide
- JChem Base User's Guide
- Query Guide
- Search types
- Similarity search
- Query features JCB
- Stereochemistry JCB
- Special search types
- Search options
- Atomproperty specific search options
- Attached data specific search options
- Bond specific search options
- Chemical terms specific search options
- Database specific search options
- General search options
- Hitdisplay specific search options
- Markush structure specific search options
- Performance specific search options
- Polymer specific search options
- Query feature specific search options
- Reaction specific search options
- Resultset specific search options
- Similarity specific search options
- Stereo specific search options
- Tautomer specific search options
- Tautomer search - Vague bond search - sp-Hybridization
- Standardization JCB
- Hit display-coloring
- Appendix JCB
- Matching Query - Target Examples
- jcsearch Command Line Tool
- jcunique Command Line Tool
- Homology Groups in Markush Structures
- Query Guide
- JChem Base FAQ
- JChem Base History of Changes
- JChem Base Getting Help and Support
- JChem Base Licensing
- JChem Choral
- JChem Oracle Cartridge
- JChem Microservices
- Calculations Web Services
- DB Web Services
- IO Web Services
- Markush Web Services
- Reactor Web Services
- Structure Checker Web Services
- Structure Manipulation
- Second Generation Search Engine
- Task Manager
- JChem Microservices FAQ and Known Issues
- JChem Microservices History of Changes
- Marvin JS Web Services
- JChem PostgreSQL Cartridge
- Getting Started JChem PostgreSQL Cartridge
- JChem PostgreSQL Cartridge Manual
- Second Generation Search Engine
- JChem PostgreSQL Cartridge FAQ and Known Issues
- JChem PostgreSQL Cartridge History of Changes
- JChem PostgreSQL Cartridge Getting Help and Support
- JChem PostgreSQL Cartridge Licensing
- Comparison of JChem PostgreSQL Cartridge and JChem Oracle Cartridge
- Migration Guide
- JChem Web Services Classic
- JKlustor
- Markush Tools
- Marvin JS
- User Guide
- Getting Started
- Editor Overview
- Editor Canvas
- Dialogs
- Toolbars
- Context Menus
- Drawing and Editing Options
- Feature Overview Pages
- Keyboard Shortcuts
- Developer Resources
- History of Changes
- Frequently Asked Questions
- Video Tutorials
- Comparison of Marvin JS and MarvinSketch Feature Sets
- User Guide
- Name to Structure
- Reactor
- Reactor User's Guide
- Introduction to Reactor
- Reactor Getting Started
- Reactor Concepts
- Reactor Examples
- Working with Reactor
- Specifying Reactions
- Specifying Reactants
- Reaction Mapping
- Reaction Rules
- Reactant Combinations
- Running Reactor
- Reactor Interfaces
- Reactor Application
- Reactor Command-line Application
- Reactor in Instant JChem
- Reactor in JChem for Excel
- Reactor in KNIME
- Reactor in Pipeline Pilot
- Reactor in Plexus Suite
- API, Web Services
- Glossary
- Reactor FAQ
- Reactor Licensing
- Reactor Getting Help and Support
- Reactor History of Changes
- Reactor Configuration Files
- Reactor User's Guide
- Screen
- Standardizer
- Standardizer User's Guide
- Standardizer Introduction
- Standardizer Getting Started
- Standardizer Concepts
- Working with Standardizer
- Standardizer Actions
- Add Explicit Hydrogens
- Alias to Atom
- Alias to Group
- Aromatize
- Clean 2D
- Clean 3D
- Clear Isotopes
- Clear Stereo
- Contract S-groups
- Convert Double Bonds
- Convert Pi-metal Bonds
- Convert to Enhanced Stereo
- Create Group
- Dearomatize
- Disconnect Metal Atoms
- Expand S-groups
- Expand Stoichiometry
- Map
- Map Reaction
- Mesomerize
- Neutralize
- Remove Absolute Stereo
- Remove Atom Values
- Remove Attached Data
- Remove Explicit Hydrogens
- Remove Fragment
- Remove R-group Definitions
- Remove Stereo Care Box
- Replace Atoms
- Set Absolute Stereo
- Set Hydrogen Isotope Symbol
- Strip Salts
- Tautomerize
- Transform
- Ungroup S-groups
- Unmap
- Wedge Clean
- Remove
- Standardizer Transform
- Custom Standardizer Actions
- Remove Solvents
- Creating a Configuration Standardizer
- Interfaces Standardizer
- Standardizer File Formats
- Standardizer Actions
- Standardizer Developer's Guide
- Standardizer Installation and System Requirements
- Standardizer Licensing
- Standardizer Getting Help and Support
- Standardizer History of Changes
- Standardizer User's Guide
- Structure Checker
- Structure Checker User's Guide
- Introduction
- Structure Checker Getting Started
- Structure Checker Concepts
- Working with Structure Checker
- Checker List
- Abbreviated Group StrCh
- Absent Chiral Flag
- Absolute Stereo Configuration
- Alias
- Aromaticity Error
- Atom Map
- Atom Query Property
- Atom Value
- Atropisomer
- Attached Data StrCh
- Bond Angle
- Bond Length
- Brackets
- Chiral Flag
- Chiral Flag Error
- Circular R-group Reference
- Coordination System Error
- Covalent Counterion
- Crossed Double Bond
- Custom Checkers and Fixers
- Double Bond Stereo Error
- EZ Double Bond
- Empty Structure
- Explicit Hydrogen
- Explicit Lone Pairs
- Incorrect Tetrahedral Stereo
- Isotope
- Metallocene Error
- Missing Atom Map
- Missing R-group Reference
- Molecule Charge
- Multicenter
- Multicomponent
- Multiple Stereocenter
- Non-standard Wedge Scheme
- Non-stereo Wedge Bond
- OCR Error
- Overlapping Atoms
- Overlapping Bonds
- Pseudo Atom
- Query Atom
- Query Bond
- Racemate
- Radical
- Rare Element
- R-atom
- Reacting Center Bond Mark
- Reaction Map Error
- Relative Stereo
- R-group Attachment Error
- R-group Bridge Error
- R-group Reference Error
- Ring Strain Error
- Solvent
- Star Atom
- Stereo Care Box
- Stereo Inversion Retention Mark
- Straight Double Bond
- Substructure
- Three Dimension 3D
- Unbalanced Reaction
- Unused R-group Reference
- Valence Error
- Valence Property
- Wedge Error
- Wiggly Bond
- Wiggly Double Bond
- Creating a Configuration StrCh
- Interfaces StrCh
- Checker List
- Structure Checker Developer's Guide
- Structure Checker Installation and System Requirements
- Structure Checker Licensing
- Structure Checker Getting Help and Support
- Structure Checker History of Changes
- Structure Checker User's Guide
- Structure to Name
- Third-party Integration
- JChem for Office
- Before Using
- Supported Versions
- Installation
- Administration
- Diagnostic Tool
- JChem for Excel User's Guide
- JChem for Excel Ribbon
- Working with Structures in Excel
- Add a Structure to a Cell
- Edit a Structure in a Cell
- Edit Structures in the Task Pane
- Resize Structures
- Structures in Merged Cells
- Show and Hide Structures
- Show and Hide Structures and Structure IDs
- Insert Single Structures
- Open Structure Files
- Delete Structures from a Selected Range
- Save Single Structure to a File
- Print Structures
- Copy and Paste with JChem for Excel
- Convert from Structures
- Convert to Structures
- Convert ISIS, ChemDraw, Accord, and Insight for Excel Files to JChem for Excel Files
- Calculations with Third-Party Services
- Specify External Image and Name Services
- Importing from Databases in JChem for Excel
- Manage Connections
- Add an Oracle Connection in JChem for Excel
- Add a MySQL Connection in JChem for Excel
- Add an MSSQL Connection in JChem for Excel
- Add a PostgreSQL Connection in JChem for Excel
- Add a JChem Web Services Connection in JChem for Excel
- Favorite Entities in JChem for Excel
- Edit and Delete Connections in JChem for Excel
- Import from Database in JChem for Excel
- Import from IJC Database in JChem for Excel
- Import from Database by IDs
- Manage Connections
- Resolve ID
- Import from File
- Export to File
- Save to Share
- R-group Decomposition in JChem for Excel
- SAR Table Generation
- Structure Filter
- Options in JChem for Excel
- General Options in JChem for Excel
- Database Connection Options
- Formatting Options
- Licensing Options in JChem for Excel
- File Import Options in JChem for Excel
- IJC Import Options in JChem for Excel
- File Export Options in JChem for Excel
- Printing Options in JChem for Excel
- Structure Sheet Options
- Image Conversion Options
- Structure Display Options in JChem for Excel
- Structure Editor Options in JChem for Excel
- Event Handling Options in JChem for Excel
- Actions
- Functions in JChem for Excel
- Custom Chemical Functions in JChem for Excel
- Use Custom Chemical Functions
- Functions Reference
- Normal
- Charge in JChem for Excel
- Chemical Terms in JChem for Excel
- Dissimilarity
- Drug Discovery Filtering in JChem for Excel
- Elemental Analysis in JChem for Excel
- Geometry in JChem for Excel
- Hydrogen Bond Donor-Acceptor in JChem for Excel
- Isomers in JChem for Excel
- Naming
- Protonation and Partitioning in JChem for Excel
- Solubility
- Tautomers in JChem for Excel
- Topology Analysis in JChem for Excel
- Structure in JChem for Excel
- Image
- Normal
- User Interface Customization in JChem for Excel
- Checking DirectX Information
- JChem for Office User's Guide
- JChem Ribbon
- Working with Structures
- Importing from Databases in JChem for Office
- Manage Connections in JChem for Office
- Add an Oracle Connection in JChem for Office
- Add a MySQL Connection in JChem for Office
- Add an MSSQL Connection in JChem for Office
- Add a PostgreSQL Connection in JChem for Office
- Add a JChem Web Services Connection in JChem for Office
- Favorite Entities in JChem for Office
- Edit and Delete Connections in JChem for Office
- Import from Database in JChem for Office
- Import from IJC Database
- Manage Connections in JChem for Office
- Import from File in Jchem for Office
- Options in JChem for Office
- Properties in JChem for Office
- Switching JChem for Office to Lite Mode
- JChem for Office Lite User's Guide
- JChem for Office Known Issues
- JChem for Office History of Changes
- KNIME Nodes
- Pipeline Pilot Components
- JChem for Office
- Cross Product Documentation
- ChemAxon Configuration Folder
- Chemical Fingerprints
- Chemical Terms
- File Formats
- Basic export options
- Compression and Encoding
- Document formats
- Graphics Formats
- Molecule file conversion with Molconverter
- Molecule Formats
- CML
- MDL MOL files
- Daylight SMILES related formats
- ChemAxon SMILES extensions
- IUPAC InChI, InChIKey, RInChI and RInChIKey
- Name
- Sequences - peptide, DNA, RNA
- FASTA file format
- Protein Data Bank (PDB) file format
- Tripos SYBYL MOL and MOL2 formats
- XYZ format
- Gaussian related file formats
- Markush DARC format - VMN
- CSV
- Input and Output System
- License Management
- Long Term Supported Releases - LTS
- Notice about CAS Registry Numbers®
- Public Repository
- Scientific Background
- Structure Representation
- Structure Representation - Class Representation
- Aromaticity
- Implicit, Explicit and Query Hydrogens
- Assigning stereochemistry descriptors
- Cleaning options
- Deprecated and Removed Methods
- Relative configuration of tetrahedral stereo centers
- Iterator Factory
- Atom and bond-set handling
- Graphic object handling
- Supported Java Versions
- Legal
- Legal Documents
- Cookie Policy
- End User License Agreement
- End User Subscription Agreement - EUSA
- Personal Data Management - General
- Personal Data Management - Newsletter Subscriptions
- Privacy Policy
- Privacy Policy for ChemAxon Synergy
- Terms of Use
- Terms and Conditions for UX Research Program
- Notice for ChemAxon Software User Experience (UX) Research
- Recording Policy
- White Papers
- Legal Documents
- Discontinued Products
- Document to Database
- Fragmenter
- JChem Neo4j Cartridge
- Markush Overlap
- MarvinSpace
- MarvinSpace User's Guide
- MarvinSpace Developer's Guide
- MarvinSpace History of Changes
- Metabolizer
- Plexus Suite
- Quick Start Guide - Plexus Suite
- Plexus Suite User Guide
- Log in to Plexus Suite
- The Plexus Suite Dashboard
- Importing New Data
- Exporting Your Data
- Browsing in Your Data Set
- Selecting Data
- Searching in Your Database
- Saved Queries
- List Management
- Sorting Data
- Sharing Data with Other Users
- Calculating Molecular Properties for Single Compounds
- Adding calculated columns to tables
- Scaffold Based Enumeration
- Reaction Based Enumeration
- Registering Molecules in the Corporate Database
- Charts view
- Plexus Suite Video Tutorials
- Plexus Suite Administrator Guide
- Plexus Suite Authentication
- Sharing Schema Items Among Users
- Business Flags
- Row-level Security
- Building blocks
- Admin Tools
- Adding JavaScript Files for Custom Functionality
- Writing JavaScript Files for Custom Functionality
- Integration with ChemAxon's Compound Registration System
- Shared data sources in Plexus Connect
- Configuration Files
- Edit Views
- Simple table
- Installation and System Requirements of Plexus Suite
- Plexus Suite Licensing
- Getting Help and Support for Plexus Suite
- Plexus Suite FAQ
- Plexus Suite Privacy Policy
- Terms of Use for the Plexus Suite Demo Site
- Plexus Suite History of Changes
- Schema Refresh Without Restart
R-group decomposition
To extend chemistry handling capabilities of Plexus Connect, the R-group decomposition feature has been added in version 20.20.0. As functional groups have significant impact to physical-chemical properties of a molecule, their visualization helps better understand structure-activity relationships between molecules in a given dataset. Using R-group decomposition, structural variations of molecules can be displayed in a comprehensible plot, different functional groups can be compared and relationships between molecules and their properties can easily be explored.
Based on the current implementation in Plexus Connect, the R-group decomposition can be performed for a given collection of molecules which consist of R1 and R2 groups and a scaffold. The scaffold is defined by the user and usually represents the central structure of the molecule. By performing R-group decomposition, the molecules are queried against the scaffold, and its ligands (attachment groups) at certain positions are identified. The ligand attachment points are represented by R-groups. As a result of decomposition, variations of ligands present in the queried molecules are displayed as values on axes (by default, R1 groups as horizontal axis values and R2 groups as vertical axis values).
There are two types of visualization of the R-group decomposition plot:
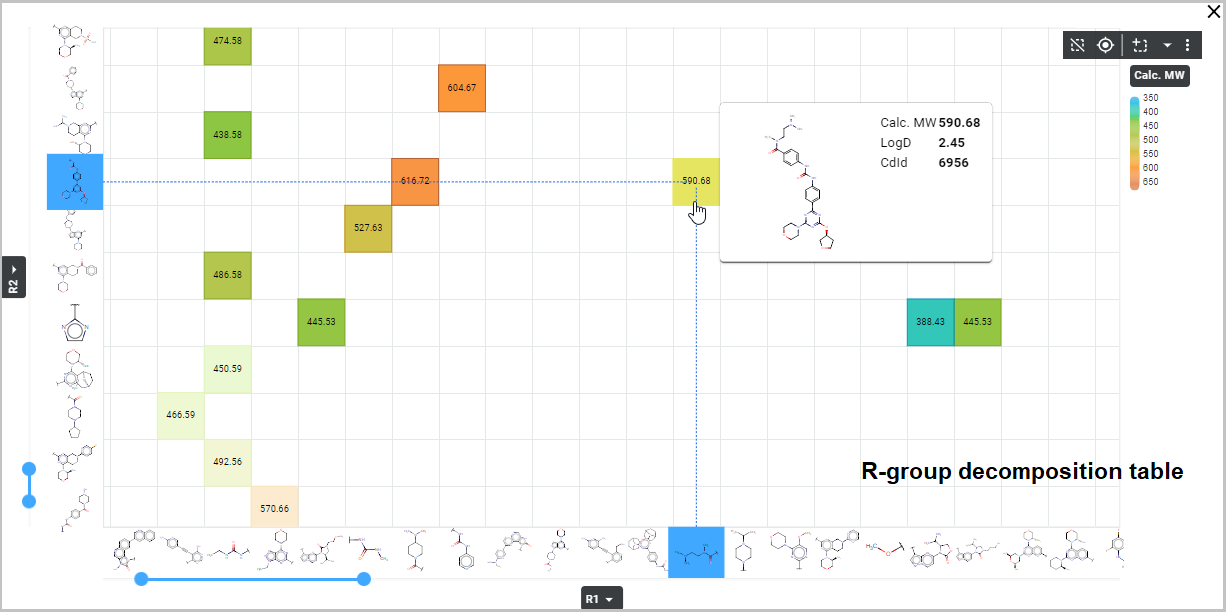
- The first option is to display it as a table. In this case, the R-groups are displayed as columns and rows of the table (i. e. axes of the plot) and in the cells of the table (i. e. grid points of the plot) a pre-selected database field value appears. This field can be numerical, text or Boolean – e. g. mol weight, logP, logD, TPSA, CNS MPO values can be shown.
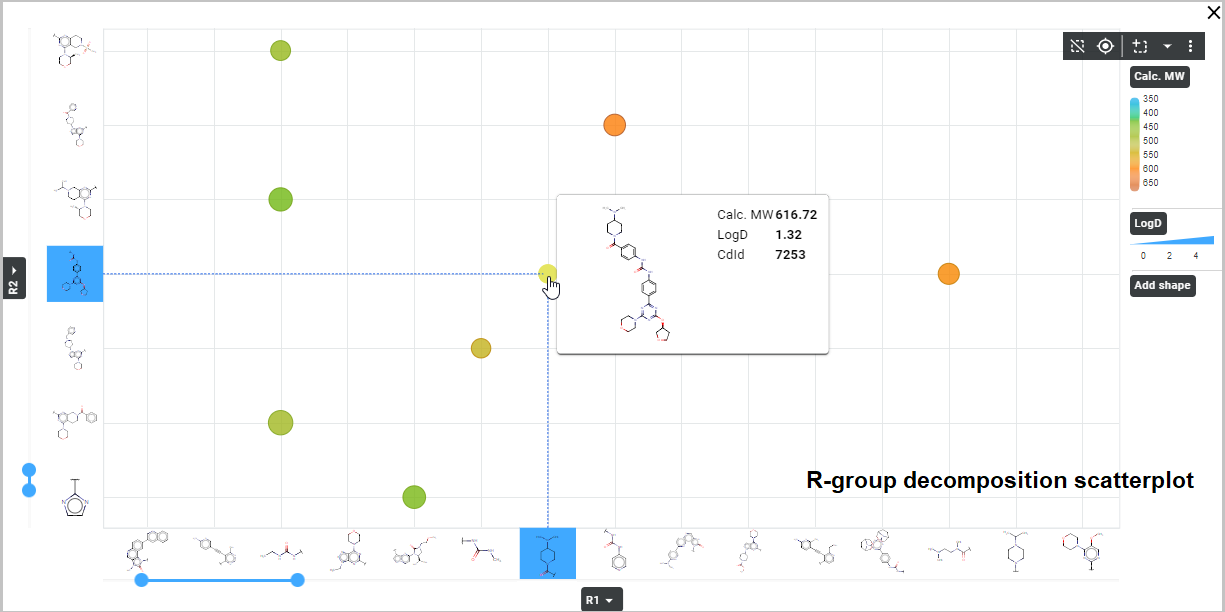
- The second option is to display the R-group decomposition as a scatterplot. Thus, the R-groups are displayed on axes of the plot (similarly as in the previous case) and pre-selected database field values are represented by datapoints of the scatterplot – datapoints color, size and shape can be configured based on database field values. Numerical and Boolean field values can be visualized on datapoints – e. g. mol weight, logP, logD, TPSA, CNS MPO values.
Creating an R-group decomposition plot
To perform R-group decomposition in your dataset, open the corresponding view (grid view or form view) containing your structures and click the R-group icon on the navigation toolbar ( ![]() ).
).
Using the toggle button at the top of the "Add new R-group decomposition" dialog window, you can display the R-group decomposition results as a table (toggle on ) or as a scatterplot (toggle off ).
Below this option, the scaffold and the R1 and R2 groups need to be defined. Please note: to execute the R-group decomposition, exactly two R-groups (R1 and R2) must be defined. Defining a single R-group or more than two R-groups is not supported. To draw the desired structure, click the pen icon and draw your scaffold with R-groups in Marvin JS. In your dataset, Plexus Connect will perform substructure search against your scaffold. Its ligands in R1 and R2 positions will be displayed as an R-group decomposition plot.
The options available for field selection depend on the selected R-group decomposition plot type – table or scatterplot.
In the case of an R-group table , a cell value field needs to be selected. From the dropdown menu, select the field whose values are to be displayed in the cells of the R-group table. The values will be colored based on the current color scheme displayed next to the field selection dropdown. To customize the color scheme, set the desired colors for maximum and minimum values from a color palette that opens by clicking the corresponding color field.
When displaying an R-group decomposition plot as a scatterplot (toggle button "Display as a table" off), coloring, size, and shape of datapoints need to be set using field selection from the appropriate dropdown menus. Custom coloring of datapoints is also available – the color scheme is customizable, in a similar way as cell value color customization for R-group table (see above).
Apart from the field selection described above, the properties to be displayed in the Card can be selected by clicking the corresponding fields in the Additional fields section (below the cell value field dropdown in R-group tables and below datapoint color/size/shape dropdowns in R-group scatterplots). Displaying a structure and relevant properties on the Card can be helpful to discover your molecules and their characteristics in the context of other molecules visualized in the same R-group decomposition plot. By hovering over a cell (in an R-group table) or over a data point (in an R-group scatterplot), the structure and selected properties of the related molecule appear on the Card.
R-group decomposition table and scatterplot options
Both for R-groups table and scatterplots, variations of ligands are shown as values on the axes: R1 groups on the horizontal axis and R2 groups on the vertical axis. To define a region for displaying data, the R-group plot can be zoomed in and out using the mouse wheel (this functionality is available for R-group scatterplots only).
The single axis zoom tool (represented by blue lines along each axis) provides additional navigation functionality. In both tables and scatterplots, moving one of the blue lines is used for scrolling. In scatterplots, changing the size of the blue lines by dragging one of their anchor points will zoom in/out the scatterplot along the given axis.
The scrollable legend panel of cell value coloring (for R-group tables) and data point coloring (for R-group scatterplots) shows the values of the selected database field (e.g. Calculated MolWeight) and their corresponding colors. You can switch to a new field by clicking the field name, which opens a list of all available fields. In the case of R-group scatterplots, the data point size and shape are also shown in the corresponding legend panels.
Saving and sharing the result set
The R-group decomposition result set (i.e. molecules containing the scaffold and the R1 and R2 groups) can be stored in the form of a list by clicking the Lists icon on the upper control panel and choosing New List from the selection option. More details about creating lists and lists management are available in the Plexus Connect documentation here.
As Plexus Connect enables data sharing between collaborators via URL, the result set of the R-group decomposition can also be shared. The URL reflects the R-group decomposition result set, the scaffold with R-groups and the R-group plot. By sharing the URL, your peers can access the result set and further explore your R-group decomposition results. Detailed guidelines about sharing views via URL can be found here.
Data selection
Similarly as in Plexus Connect Charts, data displayed in an R-group decomposition plot are automatically synchronized with a corresponding view. This means that data selected in the R-group decomposition plot (both table and scatterplot) is also selected in the view and vice versa. The structures in the view are aligned based on scaffold and R-groups orientation defined by the user. The scaffold and the R-groups are colored differently, helping to visually distinguish between the scaffold and the R-groups.
Data selection can be done either within the view or within the R-group plot using one of the available selection tools:
-
Rectangular selection
-
Rectangular deselection
-
Freehand selection
-
Freehand deselection
-
Cherry-picking (selection of individual datapoints in a scatterplot or individual cells in a table)
The selection tools for rectangular selection and deselection, freehand selection and deselection can be found in the dropdown menu on the legend panel.
By clicking the Deselect All icon on the legend panel, the whole selection switches back to its default state both in the view and in the R-group plot.
Saving an R-group decomposition plot
The R-group decomposition plot can be saved as a PNG or SVG file. This functionality is available by clicking the menu option on the legend panel.
Administration
R-group decomposition and related functionalities can be enabled / disabled by Plexus Connect administrator using PLEXUS_CHARTS business flag available in the featureFlags.properties file by setting the property to true or false, respectively. The changes will take effect the next log-in to Plexus Connect.