Connect Scripting via Jupyter Notebook
- This brief tutorial is created for the demo project. If you're using a different schema, you will need to modify the values accordingly.
- Replace
<YOUR_API_KEY>in the first code snippet with your own API key.
Connecting to Connect session
from connect_api import DataApi
import json
# DataApi("apiKey", ["serverSchemaId"]) or DataApi("apiKey", ["serverSchemaId1", "serverSchemaId2"]) for 2 schemas
api = DataApi("<YOUR_API_KEY>", ["6C6F63616C6462"], connectUrl = "http://localhost:8080")
da = api.context.get("/rest/user/signedInUser")
print("Logged user is " + json.loads(da.text)["userName"])
Display all view names
Display all views associated to a project.
['Pubchem grid view',
 'Wombat activities (multi-entity table)',
 'Compact fields',
 'Wombat (calc fields)',
 'Wombat (charts overview)',
 'Wombat (compound view) compounds',
 'Wombat (widgets overview)',
 'Pubchem conditional formatting',
 'Pubchem single record form',
 'Pubchem tabular form']
Connect to a View
Open view session
View session is an object which enables the user to query data and get other information related to the view.
First we connect to the pubchem view session.
Next, let's connect to the wombat view session
Perform query and get data
Querying data is based on the jchem query language. Connect API uses the QueryTerm object to perform analogous queries.
Get data tree associated to the pubchem view
Get id field and molweight fields
cdId = dt.getFieldByName("CdId")
mw = dt.getFieldByName("Mol Weight")
dbname = dt.getFieldByName("DB name")
Query all items where ID field (CdId) has larger value than 1003.
[JUST INPUT TO THE QUERY] Print ID of an ID field.
'18BCBE8A4D74E975267DFA2C991E16B8'
Now retrieve all data which satisfies the query and display first 10 results
[[1004, 169.073, 'BioCyc'],
 [1005, 202.55, 'BioCyc'],
 [1006, 163.184, 'BioCyc'],
 [1007, 148.158, 'BioCyc'],
 [1008, 260.135, 'BioCyc'],
 [1009, 473.446, 'BioCyc'],
 [1010, 98.95, 'BioCyc'],
 [1011, 181.44, 'BioCyc'],
 [1012, 290.447, 'BioCyc'],
 [1013, 169.136, 'BioCyc']]
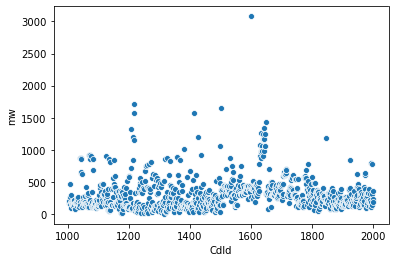
Make a scatter plot of the data. Here I use seaborn library for that purpose
Analyze data
import seaborn as sns
import pandas as pd
ids = [inner_list[0] for inner_list in allData]
molweights = [inner_list[1] for inner_list in allData]
dbnames = [inner_list[2] for inner_list in allData]
df = pd.DataFrame()
df['CdId']=ids
df['mw']=molweights
df['dbname']=dbnames
print(f"The dataframe has {df.shape[0]} rows and {df.shape[1]} columns.")
_=sns.scatterplot(x='CdId', y='mw', data=df)
The dataframe has 997 rows and 3 columns.
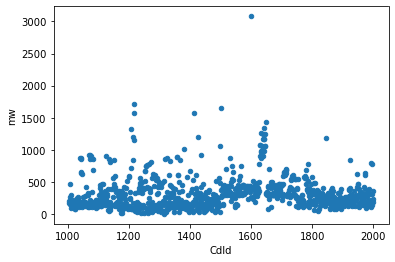
Alternatively this can be done simply by using pandas (both plotting in pandas and seaborn are using an underscoring matplotlib library. However the implementation and settings are different, therefore different default aesthetics.)
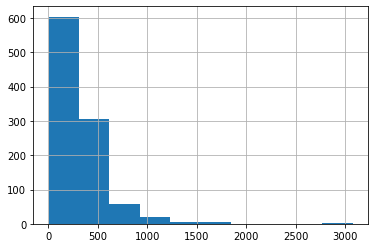
if I want to look at the distribution of molecular weights, then this can be achieved again by using pandas library's methods.
Let's look at the original databases and their relations to molecular weigths. First, we check how many molecules belong to what database.
KEGG                      250
MOLI                      250
NIST Chemistry WebBook    250
BioCyc                    247
Name: dbname, dtype: int64
Then we display this using a scatterplot
<AxesSubplot:xlabel='mw', ylabel='CdId'>
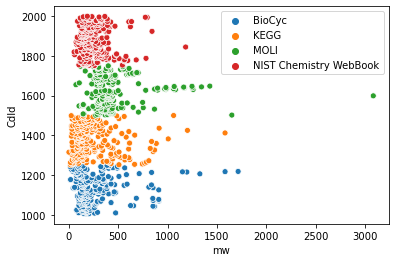
We can see here, that molecules from all four constituing databases have similar molecular weights. However, to really check that, we need different vizualization. Violin plot might come in handy
<AxesSubplot:ylabel='mw'>
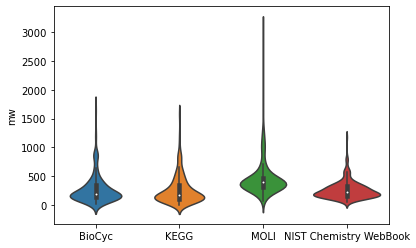
Now, we could say that the mass composition of molecules from the databases is indeed very similar with one possible exception being the MOLI database.
Perform query in wombat
Let's begin by displaying all fields.
Field names: ['Num assay vals', 'Formula', 'ID', 'MOL.REF', 'VALUE.MIN', 'BIND.NONSPECIFIC', 'EST.LOGKOW', 'BIND.ENDOGENLIGAND', 'SMDL.ID', 'SMDL.IDX', 'BIO.TISSUETYPE', 'OTHER', 'SMDL.SID', 'VALUE', 'ID', 'BIO.CELL', 'BIND.RADIOLIGAND', 'BIO.SPECIES', 'SWISSP.ID', 'EXP.LOGKOW', 'MOL.GNAME', 'TARGET.TYPE', 'REC.NAME', 'MOL.SMI', 'Date', 'Wombat structures ID', 'VALUE.MAX', 'EST.LOGWSOL', 'Structure', 'Atoms', 'CdId', 'WOMBAT_ACT_LIST_ID', 'TYPE', 'BIO.TISSUESOURCE', 'EXP.LOGWSOL', 'BIO.STIMULUS', 'SWISSP.SPECIES', 'REC.TYPE', 'TARGET.NAME', 'BIO.EFFECT', 'Assay values', 'Rings', 'MOL.NAME', 'Mol Weight', 'logP / MW', 'REC.FAMILY']
cdId_2 = dt2.getFieldByName("CdId")
# here I intend to retrieve all data. Therefore, I am using a larger than negative ID
qt = QueryTerm(cdId_2.fieldId, ["-1"], ">")
And why not also retrieve all fields?
output
[[3,
'C18H19ClN2O2',
470,
'Bioorg. Med. Chem. Lett. 12(2)-2002 243-248',
8.720000267028809,
None,
4.980000019073486,
None,
470,
'SMDL-00000470',
None,
None,
23,
'8.7200',
'1',
'L929 cell',
'[125I]R-91150',
'human',
'P28223',
None,
'R-95292',
'receptor',
'serotonergic receptor',
'CN(C)CC1CC2N(O1)c3cc(Cl)ccc3Oc4ccccc24',
None,
1,
8.720000267028809,
-5.9670000076293945,
'$RDFILE 1\n$DATM 2/25/2004 7:34:48\n$MFMT $MIREG 470\n\n  -ISIS-  02250407342D\n\n 23 26  0  0  0  0  0  0  0  0999 V2000\n    4.5542   -1.9042    0.0000 N   0  0  3  0  0  0  0  0  0  0  0  0\n    5.3042   -1.9125    0.0000 C   0  0  3  0  0  0  0  0  0  0  0  0\n    4.0792   -2.4917    0.0000 C   0  0  0  0  0  0  0  0  0  0  0  0\n    4.3250   -1.1917    0.0000 O   0  0  0  0  0  0  0  0  0  0  0  0\n    5.7625   -2.4917    0.0000 C   0  0  0  0  0  0  0  0  0  0  0  0\n    4.9250   -3.5500    0.0000 O   0  0  0  0  0  0  0  0  0  0  0  0\n    4.2500   -3.2167    0.0000 C   0  0  0  0  0  0  0  0  0  0  0  0\n    5.5917   -3.2250    0.0000 C   0  0  0  0  0  0  0  0  0  0  0  0\n    4.9375   -0.7500    0.0000 C   0  0  3  0  0  0  0  0  0  0  0  0\n    5.5417   -1.1917    0.0000 C   0  0  0  0  0  0  0  0  0  0  0  0\n    3.3667   -2.2667    0.0000 C   0  0  0  0  0  0  0  0  0  0  0  0\n    3.7042   -3.7292    0.0000 C   0  0  0  0  0  0  0  0  0  0  0  0\n    4.9417    0.0083    0.0000 C   0  0  0  0  0  0  0  0  0  0  0  0\n    2.8250   -2.7792    0.0000 C   0  0  0  0  0  0  0  0  0  0  0  0\n    4.2875    0.3875    0.0000 N   0  0  3  0  0  0  0  0  0  0  0  0\n    2.9917   -3.5125    0.0000 C   0  0  0  0  0  0  0  0  0  0  0  0\n    2.1000   -2.5542    0.0000 Cl  0  0  0  0  0  0  0  0  0  0  0  0\n    6.4750   -2.2750    0.0000 C   0  0  0  0  0  0  0  0  0  0  0  0\n    6.1417   -3.7375    0.0000 C   0  0  0  0  0  0  0  0  0  0  0  0\n    3.6292    0.0083    0.0000 C   0  0  0  0  0  0  0  0  0  0  0  0\n    4.2917    1.1458    0.0000 C   0  0  0  0  0  0  0  0  0  0  0  0\n    7.0250   -2.7792    0.0000 C   0  0  0  0  0  0  0  0  0  0  0  0\n    6.8625   -3.5167    0.0000 C   0  0  0  0  0  0  0  0  0  0  0  0\n  2  1  1  0  0  0  0\n  3  1  1  0  0  0  0\n  4  1  1  0  0  0  0\n  5  2  1  0  0  0  0\n  6  7  1  0  0  0  0\n  7  3  2  0  0  0  0\n  8  5  2  0  0  0  0\n  9  4  1  0  0  0  0\n 10  2  1  0  0  0  0\n 11  3  1  0  0  0  0\n 12  7  1  0  0  0  0\n 13  9  1  0  0  0  0\n 14 11  2  0  0  0  0\n 15 13  1  0  0  0  0\n 16 14  1  0  0  0  0\n 17 14  1  0  0  0  0\n 18  5  1  0  0  0  0\n 19  8  1  0  0  0  0\n 20 15  1  0  0  0  0\n 21 15  1  0  0  0  0\n 22 18  2  0  0  0  0\n 23 22  1  0  0  0  0\n 10  9  1  0  0  0  0\n  8  6  1  0  0  0  0\n 12 16  2  0  0  0  0\n 19 23  2  0  0  0  0\nM  END\n',
42,
1,
1,
'IC50',
'cloned',
None,
None,
'human',
None,
'5-HT2A',
'antagonist',
'IC50 [5-HT2A] 8.7200\nIC50 [5-HT2C] 8.4200\nIC50 [H1] 6.9900\n',
4,
'1',
330.81,
66.42771058895421,
'GPCR'],
[3,
'C18H19ClN2O2',
470,
'Bioorg. Med. Chem. Lett. 12(2)-2002 243-248',
8.420000076293945,
None,
4.980000019073486,
None,
470,
'SMDL-00000470',
None,
None,
23,
'8.4200',
'2',
'CHO cell',
'[3H]mesulergine',
'human',
'P28335',
None,
'R-95292',
'receptor',
'serotonergic receptor',
'CN(C)CC1CC2N(O1)c3cc(Cl)ccc3Oc4ccccc24',
None,
1,
8.420000076293945,
-5.9670000076293945,
'$RDFILE 1\n$DATM 2/25/2004 7:34:48\n$MFMT $MIREG 470\n\n  -ISIS-  02250407342D\n\n 23 26  0  0  0  0  0  0  0  0999 V2000\n    4.5542   -1.9042    0.0000 N   0  0  3  0  0  0  0  0  0  0  0  0\n    5.3042   -1.9125    0.0000 C   0  0  3  0  0  0  0  0  0  0  0  0\n    4.0792   -2.4917    0.0000 C   0  0  0  0  0  0  0  0  0  0  0  0\n    4.3250   -1.1917    0.0000 O   0  0  0  0  0  0  0  0  0  0  0  0\n    5.7625   -2.4917    0.0000 C   0  0  0  0  0  0  0  0  0  0  0  0\n    4.9250   -3.5500    0.0000 O   0  0  0  0  0  0  0  0  0  0  0  0\n    4.2500   -3.2167    0.0000 C   0  0  0  0  0  0  0  0  0  0  0  0\n    5.5917   -3.2250    0.0000 C   0  0  0  0  0  0  0  0  0  0  0  0\n    4.9375   -0.7500    0.0000 C   0  0  3  0  0  0  0  0  0  0  0  0\n    5.5417   -1.1917    0.0000 C   0  0  0  0  0  0  0  0  0  0  0  0\n    3.3667   -2.2667    0.0000 C   0  0  0  0  0  0  0  0  0  0  0  0\n    3.7042   -3.7292    0.0000 C   0  0  0  0  0  0  0  0  0  0  0  0\n    4.9417    0.0083    0.0000 C   0  0  0  0  0  0  0  0  0  0  0  0\n    2.8250   -2.7792    0.0000 C   0  0  0  0  0  0  0  0  0  0  0  0\n    4.2875    0.3875    0.0000 N   0  0  3  0  0  0  0  0  0  0  0  0\n    2.9917   -3.5125    0.0000 C   0  0  0  0  0  0  0  0  0  0  0  0\n    2.1000   -2.5542    0.0000 Cl  0  0  0  0  0  0  0  0  0  0  0  0\n    6.4750   -2.2750    0.0000 C   0  0  0  0  0  0  0  0  0  0  0  0\n    6.1417   -3.7375    0.0000 C   0  0  0  0  0  0  0  0  0  0  0  0\n    3.6292    0.0083    0.0000 C   0  0  0  0  0  0  0  0  0  0  0  0\n    4.2917    1.1458    0.0000 C   0  0  0  0  0  0  0  0  0  0  0  0\n    7.0250   -2.7792    0.0000 C   0  0  0  0  0  0  0  0  0  0  0  0\n    6.8625   -3.5167    0.0000 C   0  0  0  0  0  0  0  0  0  0  0  0\n  2  1  1  0  0  0  0\n  3  1  1  0  0  0  0\n  4  1  1  0  0  0  0\n  5  2  1  0  0  0  0\n  6  7  1  0  0  0  0\n  7  3  2  0  0  0  0\n  8  5  2  0  0  0  0\n  9  4  1  0  0  0  0\n 10  2  1  0  0  0  0\n 11  3  1  0  0  0  0\n 12  7  1  0  0  0  0\n 13  9  1  0  0  0  0\n 14 11  2  0  0  0  0\n 15 13  1  0  0  0  0\n 16 14  1  0  0  0  0\n 17 14  1  0  0  0  0\n 18  5  1  0  0  0  0\n 19  8  1  0  0  0  0\n 20 15  1  0  0  0  0\n 21 15  1  0  0  0  0\n 22 18  2  0  0  0  0\n 23 22  1  0  0  0  0\n 10  9  1  0  0  0  0\n  8  6  1  0  0  0  0\n 12 16  2  0  0  0  0\n 19 23  2  0  0  0  0\nM  END\n',
42,
1,
2,
'IC50',
'cloned',
None,
None,
'human',
None,
'5-HT2C',
'antagonist',
'IC50 [5-HT2A] 8.7200\nIC50 [5-HT2C] 8.4200\nIC50 [H1] 6.9900\n',
4,
'1',
330.81,
66.42771058895421,
'GPCR']]
Now, I would like to take all the data and turn it into pandas dataframe object. (This may take a little while).
wombat_df = pd.DataFrame()
for i, field_name in enumerate([field.name for field in dt2.root.fields]):
    wombat_df[field_name] =  [inner_list[i] for inner_list in wombat_vs.getData([field.fieldId for field in dt2.root.fields])]
Let's keep using 'CdId' as an index column instead of creating new one. Also, let's display first five rows:
| Num assay vals | Formula | ID | MOL.REF | VALUE.MIN | BIND.NONSPECIFIC | EST.LOGKOW | BIND.ENDOGENLIGAND | SMDL.ID | SMDL.IDX | ... | SWISSP.SPECIES | REC.TYPE | TARGET.NAME | BIO.EFFECT | Assay values | Rings | MOL.NAME | Mol Weight | logP / MW | REC.FAMILY | |
|---|---|---|---|---|---|---|---|---|---|---|---|---|---|---|---|---|---|---|---|---|---|
| CdId | |||||||||||||||||||||
| 1 | 3 | C18H19ClN2O2 | 1 | Bioorg. Med. Chem. Lett. 12(2)-2002 243-248 | 8.72 | None | 4.98 | None | 470 | SMDL-00000470 | ... | human | None | 5-HT2A | antagonist | IC50 [5-HT2A] 8.7200\nIC50 [5-HT2C] 8.4200\nIC... | 4 | 1 | 330.810 | 66.427711 | GPCR |
| 1 | 3 | C18H19ClN2O2 | 2 | Bioorg. Med. Chem. Lett. 12(2)-2002 243-248 | 8.42 | None | 4.98 | None | 470 | SMDL-00000470 | ... | human | None | 5-HT2C | antagonist | IC50 [5-HT2A] 8.7200\nIC50 [5-HT2C] 8.4200\nIC... | 4 | 1 | 330.810 | 66.427711 | GPCR |
| 1 | 3 | C18H19ClN2O2 | 3 | Bioorg. Med. Chem. Lett. 12(2)-2002 243-248 | 6.99 | None | 4.98 | None | 470 | SMDL-00000470 | ... | human | None | H1 | antagonist | IC50 [5-HT2A] 8.7200\nIC50 [5-HT2C] 8.4200\nIC... | 4 | 1 | 330.810 | 66.427711 | GPCR |
| 2 | 3 | C18H20N2 | 1 | Bioorg. Med. Chem. Lett. 12(2)-2002 243-248 | 7.98 | None | 3.35 | None | 471 | SMDL-00000471 | ... | human | None | 5-HT2A | antagonist | IC50 [5-HT2A] 7.9800\nIC50 [5-HT2C] 8.1300\nIC... | 4 | 3 | 264.372 | 78.917017 | GPCR |
| 2 | 3 | C18H20N2 | 2 | Bioorg. Med. Chem. Lett. 12(2)-2002 243-248 | 8.13 | None | 3.35 | None | 471 | SMDL-00000471 | ... | human | None | 5-HT2C | antagonist | IC50 [5-HT2A] 7.9800\nIC50 [5-HT2C] 8.1300\nIC... | 4 | 3 | 264.372 | 78.917017 | GPCR |
5 rows × 44 columns