- Standalone Applications
- BioEddie
- ChemAxon Assay
- ChemCurator
- ChemLocator
- cHemTS
- Compliance Checker
- Compound Registration
- Quick Start Guide
- Compound Registration User's Guide
- Overview
- Compound Registration Abbreviations
- Definitions of Terms
- Compound Registration Introduction
- Login
- Dashboard page
- Autoregistration
- Bulk Upload
- Advanced Registration
- Search
- User Profile
- Download
- Browse page
- Appendix A. Calculations
- Appendix B. Markush Structures
- Multi-Component compounds
- Restricted compounds
- Configuration Guide
- Deployment Guide
- Compound Registration FAQ
- Compound Registration System Requirements
- Compound Registration History of Changes
- API documentation
- Instant JChem
- Instant Jchem User Guide
- Getting Started
- IJC Projects
- IJC Schemas
- Viewing and Managing Data
- Lists and Queries
- Collaboration
- Import and Export
- Editing Databases
- Relational Data
- Chemical Calculations and Predictions
- Chemistry Functions
- Security
- Scripting
- Updating Instant JChem
- Tips and Tricks
- Instant JChem Tutorials
- Building a relational form from scratch
- Building more complex relational data models
- Defining a security policy
- Filtering items using roles
- Lists and Queries management
- Query building tutorial
- Reaction enumeration analysis and visualization
- SD file import basic visualization and overlap analysis
- Using Import map and merge
- Using Standardizer to your advantage
- Pivoting tutorial
- Instant JChem Administrator Guide
- Admin Tool
- IJC Deployment Guide
- Supported databases
- JChem Cartridge
- Using Oracle Text in Instant JChem
- Deployment via Java Web Start
- Startup Options
- Shared project configuration
- Accessing data with URLs
- Instant JChem Meta Data Tables
- Test to Production Metadata Migrator
- Filtering Items
- Deploying the IJC OData extension into Spotfire
- Reporting a Problem
- Manual Instant JChem schema admin functions
- SQL Scripts for Manual Schema Upgrade
- Database Row Level Security
- JccWithIJC
- Instant JChem Developer Guide
- Working With IJC Architecture
- IJC API
- Groovy Scripting
- Good Practices
- Schema and DataTree Scripts
- Simple SDF Exporter
- Relational SDF Exporter
- CDX File Importer
- Data Merger or Inserter from an SDF file
- Markush DCR Structures Exporter
- Select Representative Member of Clusters
- Table Standardizer
- Populate a Table with Microspecies
- Create a Diverse Subset
- Pearson Linear Correlation Co-efficient Calculator
- PDF Trawler
- Simple Substructure Search
- Intersecting Sets
- Find Entries with Duplicated Field Value
- Importing Multiple SDF Files
- Calling External Tools
- Create Relational Data Tree
- Forms Model Scripts
- Button Scripts
- Execute Permanent Query
- Patent Fetcher Button
- Batch Searching Button
- Import or Export a Saved Query SDF Button
- Back and Next Buttons
- Add Annotations Button
- Simple Structure Checker Button
- Advanced Structure Checker Button
- Calculate MolWeight and generate SMILES
- Get Current User
- Simple ChemicalTerms evaluator
- Edit Molecule Button
- TanimotoMultiple
- Execute Permanent Query Based On Its Name
- Open existing view in the same dataTree
- Export selection to file
- Generate random resultset from actual resultset
- Form Scripts
- Groovy Scriptlets
- Buttons vs Scripts
- Creating New Entities
- Creating New Fields
- Reading Molecules From a File
- Insert or Update a Row
- Evaluator
- Create or Find a Relationship
- Adding an Edge to a Data Tree
- Exporting Data to a File
- Connect to an External Database
- Create a New ChemTerm Field
- Create a New Dynamic URL Field
- Create a New Static URL Field
- Java Plugins
- IJC Plugin Quick Start
- IJC Hello World Plugin
- IJC Plugin tutorial - MyAddField plugin
- IJC Plugin tutorial - MyMathCalc plugin
- IJC Plugin tutorial - Renderer Example
- IJC Plugin tutorial - MySCServer webapp
- IJC Plugin tutorial - MySCClient plugin
- IJC Plugin tutorial - Canvas widget
- Java Plugins and Java Web Start
- Instant JChem FAQ
- Instant JChem Installation and Upgrade
- New Features
- New Features in IJC Q4 2020
- New Features in IJC Q3 2020
- New Features in IJC Q2 2020
- New Features in IJC Q1 2020
- New Features in IJC Q4 2019
- New Features in IJC Q3 2019
- New Features in IJC Q2 2019
- New Features in IJC Q1 2019
- New Features in IJC Q4 2018
- New Features in IJC Q3 2018
- New Features in IJC Q2 2018
- New Features in IJC Q1 2018
- New Features in IJC Q4 2017
- New Features in IJC Q3 2017
- New Features in IJC Q2 2017
- New Features in IJC Q1 2017
- New Features in IJC Q4 2016
- New Features in IJC Q3 2016
- New Features in IJC Q2 2016
- New Features in IJC Q1 2016
- New Features in IJC Q4 2015
- New Features in IJC Q3 2015
- New Features in IJC Q2 2015
- New Features in IJC Q1 2015
- Instant JChem Licensing
- IJC Getting Help and Support
- Instant JChem System Requirements
- Instant JChem History of Changes
- Instant Jchem User Guide
- Markush Editor
- Design Hub
- History of changes
- Install guide
- Configuration guide
- Plugin Catalogue
- Developer guide - REST API
- Developer guide - resolver plugins
- Developer guide - real time plugins
- Developer guide - real time plugin templates
- Developer guide - export plugins
- Developer guide - storage plugins
- Developer guide - company support plugins
- Developer guide - theme customization
- Install guide - Kubernetes
- Marvin Live
- User guide
- History of changes
- Install guide
- Configuration guide
- Plugin Catalogue
- Developer guide - sending data
- Developer guide - resolver plugins
- Developer guide - real time plugins
- Developer guide - export plugins
- Developer guide - theme customization
- Developer guide - storage plugins
- Developer guide - real time plugin templates
- Migration guide
- Cloud deployment
- Marvin Desktop Suite
- MarvinSketch
- User Guide
- Getting Started
- Graphical User Interface
- Working in MarvinSketch
- Structure Display Options
- Basic Editing
- Drawing Simple Structures
- Drawing More Complex Structures
- Drawing Reactions
- Using Integrated Calculations
- Graphical Objects
- Import and Export Options
- Multipage Documents
- Printing
- Chemical Features
- Marvin OLE User Guide
- Appendix
- Tutorials
- Developer Guide
- MarvinSketch Application Options
- User Guide
- MarvinView
- Marvin Desktop Suite Installation and Upgrade
- Marvin Desktop Suite History of Changes
- Marvin Desktop Suite Licensing
- MarvinSketch
- Molconvert
- Plexus Connect
- Plexus Connect - Quick Start Guide
- Plexus Connect - User Guide
- Plexus Connect - Log in
- Plexus Connect - Dashboard
- Plexus Connect - Exporting Your Data
- Plexus Connect - Export Templates
- Plexus Connect - Browsing in Your Data Set
- Plexus Connect - Selecting Data
- Plexus Connect - Searching in Your Database
- Plexus Connect - Saved Queries
- Plexus Connect - List Management
- Plexus Connect - Sorting Data
- Plexus Connect - Sharing Data with Other Users
- Plexus Connect - Charts View
- Plexus Connect - R-group Decomposition
- Plexus Connect - Administrator Guide
- Plexus Connect - Authentication
- Plexus Connect - Sharing Schema Items Among Users
- Plexus Connect - Business Flags
- Plexus Connect - Row-level Security
- Plexus Connect - Shared data sources
- Plexus Connect - Plexus storage
- Plexus Connect - Configuration Files
- Plexus Connect - Simple table
- Plexus Connect - Getting the Plexus Backend and Frontend Log Files
- Plexus Connect - Form Editor
- Plexus Connect - Scripting
- Plexus Connect - Deploying Spotfire Middle Tier solution
- Plexus Connect - Installation and System Requirements
- Plexus Connect - Licensing
- Plexus Connect - Getting Help and Support
- Plexus Connect - FAQ
- Plexus Connect - Privacy Policy
- Plexus Connect - Terms of Use for the Demo Site
- Plexus Connect - History of Changes
- Plexus Connect - Schema Refresh Without Restart
- Zosimos
- Toolkits and Components
- AutoMapper
- Calculator Plugins
- Introduction to Calculator Plugins
- Calculator Plugins User's Guide
- Calculator Plugins Developer's Guide
- Background materials
- Calculation of partial charge distribution
- Generate3D
- Isoelectric point (pI) calculation
- LogP and logD calculations
- NMR model prediction
- pKa calculation
- Red and blue representation of pKa values
- Tautomerization and tautomers
- Validation results
- Tautomerization and tautomer models of ChemAxon
- Theory of aqueous solubility prediction
- The tautomerization models behind the JChem tautomer search
- Calculators performance reports
- Calculator Plugins Licensing
- Calculator Plugins FAQ
- Calculator Plugins Getting Help and Support
- Calculator Plugins History of Changes
- Calculator Plugins System Requirements
- Biomolecule Toolkit
- ChemAxon Synergy
- ChemAxon Synergy User Guide
- ChemAxon Synergy Developer Guide
- ChemAxon Synergy Administrator Guide
- Chemaxon Synergy History of Changes
- Document to Structure
- JChem Base
- JChem Base Administration
- JChem Base Developer's Guide
- JChem Base User's Guide
- Query Guide
- Search types
- Similarity search
- Query features JCB
- Stereochemistry JCB
- Special search types
- Search options
- Atomproperty specific search options
- Attached data specific search options
- Bond specific search options
- Chemical terms specific search options
- Database specific search options
- General search options
- Hitdisplay specific search options
- Markush structure specific search options
- Performance specific search options
- Polymer specific search options
- Query feature specific search options
- Reaction specific search options
- Resultset specific search options
- Similarity specific search options
- Stereo specific search options
- Tautomer specific search options
- Tautomer search - Vague bond search - sp-Hybridization
- Standardization JCB
- Hit display-coloring
- Appendix JCB
- Matching Query - Target Examples
- jcsearch Command Line Tool
- jcunique Command Line Tool
- Homology Groups in Markush Structures
- Query Guide
- JChem Base FAQ
- JChem Base History of Changes
- JChem Base Getting Help and Support
- JChem Base Licensing
- JChem Choral
- JChem Oracle Cartridge
- JChem Microservices
- JChem PostgreSQL Cartridge
- Getting Started JChem PostgreSQL Cartridge
- JChem PostgreSQL Cartridge Manual
- Second Generation Search Engine
- JChem PostgreSQL Cartridge FAQ and Known Issues
- JChem PostgreSQL Cartridge History of Changes
- JChem PostgreSQL Cartridge Getting Help and Support
- JChem PostgreSQL Cartridge Licensing
- Comparison of JChem PostgreSQL Cartridge and JChem Oracle Cartridge
- Migration Guide
- JChem Web Services Classic
- JKlustor
- Markush Tools
- Marvin JS
- User Guide
- Getting Started
- Editor Overview
- Editor Canvas
- Dialogs
- Toolbars
- Context Menus
- Drawing and Editing Options
- Feature Overview Pages
- Keyboard Shortcuts
- Developer Resources
- History of Changes
- Frequently Asked Questions
- Video Tutorials
- Comparison of Marvin JS and MarvinSketch Feature Sets
- User Guide
- Name to Structure
- Reactor
- Reactor User's Guide
- Introduction to Reactor
- Reactor Getting Started
- Reactor Concepts
- Reactor Examples
- Working with Reactor
- Specifying Reactions
- Specifying Reactants
- Reaction Mapping
- Reaction Rules
- Reactant Combinations
- Running Reactor
- Reactor Interfaces
- Reactor Application
- Reactor Command-line Application
- Reactor in Instant JChem
- Reactor in JChem for Excel
- Reactor in KNIME
- Reactor in Pipeline Pilot
- Reactor in Plexus Suite
- API, Web Services
- Glossary
- Reactor FAQ
- Reactor Licensing
- Reactor Getting Help and Support
- Reactor History of Changes
- Reactor Configuration Files
- Reactor User's Guide
- Screen
- Standardizer
- Standardizer User's Guide
- Standardizer Introduction
- Standardizer Getting Started
- Standardizer Concepts
- Working with Standardizer
- Standardizer Actions
- Add Explicit Hydrogens
- Alias to Atom
- Alias to Group
- Aromatize
- Clean 2D
- Clean 3D
- Clear Isotopes
- Clear Stereo
- Contract S-groups
- Convert Double Bonds
- Convert Pi-metal Bonds
- Convert to Enhanced Stereo
- Create Group
- Dearomatize
- Disconnect Metal Atoms
- Expand S-groups
- Expand Stoichiometry
- Map
- Map Reaction
- Mesomerize
- Neutralize
- Remove Absolute Stereo
- Remove Atom Values
- Remove Attached Data
- Remove Explicit Hydrogens
- Remove Fragment
- Remove R-group Definitions
- Remove Stereo Care Box
- Replace Atoms
- Set Absolute Stereo
- Set Hydrogen Isotope Symbol
- Strip Salts
- Tautomerize
- Transform
- Ungroup S-groups
- Unmap
- Wedge Clean
- Remove
- Standardizer Transform
- Custom Standardizer Actions
- Remove Solvents
- Creating a Configuration Standardizer
- Interfaces Standardizer
- Standardizer File Formats
- Standardizer Actions
- Standardizer Developer's Guide
- Standardizer Installation and System Requirements
- Standardizer Licensing
- Standardizer Getting Help and Support
- Standardizer History of Changes
- Standardizer User's Guide
- Structure Checker
- Structure Checker User's Guide
- Introduction
- Structure Checker Getting Started
- Structure Checker Concepts
- Working with Structure Checker
- Checker List
- Abbreviated Group StrCh
- Absent Chiral Flag
- Absolute Stereo Configuration
- Alias
- Aromaticity Error
- Atom Map
- Atom Query Property
- Atom Value
- Atropisomer
- Attached Data StrCh
- Bond Angle
- Bond Length
- Brackets
- Chiral Flag
- Chiral Flag Error
- Circular R-group Reference
- Coordination System Error
- Covalent Counterion
- Crossed Double Bond
- Custom Checkers and Fixers
- Double Bond Stereo Error
- EZ Double Bond
- Empty Structure
- Explicit Hydrogen
- Explicit Lone Pairs
- Incorrect Tetrahedral Stereo
- Isotope
- Metallocene Error
- Missing Atom Map
- Missing R-group Reference
- Molecule Charge
- Multicenter
- Multicomponent
- Multiple Stereocenter
- Non-standard Wedge Scheme
- Non-stereo Wedge Bond
- OCR Error
- Overlapping Atoms
- Overlapping Bonds
- Pseudo Atom
- Query Atom
- Query Bond
- Racemate
- Radical
- Rare Element
- R-atom
- Reacting Center Bond Mark
- Reaction Map Error
- Relative Stereo
- R-group Attachment Error
- R-group Bridge Error
- R-group Reference Error
- Ring Strain Error
- Solvent
- Star Atom
- Stereo Care Box
- Stereo Inversion Retention Mark
- Straight Double Bond
- Substructure
- Three Dimension 3D
- Unbalanced Reaction
- Unused R-group Reference
- Valence Error
- Valence Property
- Wedge Error
- Wiggly Bond
- Wiggly Double Bond
- Creating a Configuration StrCh
- Interfaces StrCh
- Checker List
- Structure Checker Developer's Guide
- Structure Checker Installation and System Requirements
- Structure Checker Licensing
- Structure Checker Getting Help and Support
- Structure Checker History of Changes
- Structure Checker User's Guide
- Structure to Name
- Third-party Integration
- JChem for Office
- Before Using
- Supported Versions
- Installation
- Administration
- Diagnostic Tool
- JChem for Excel User's Guide
- JChem for Excel Ribbon
- Working with Structures in Excel
- Add a Structure to a Cell
- Edit a Structure in a Cell
- Edit Structures in the Task Pane
- Resize Structures
- Structures in Merged Cells
- Show and Hide Structures
- Show and Hide Structures and Structure IDs
- Insert Single Structures
- Open Structure Files
- Delete Structures from a Selected Range
- Save Single Structure to a File
- Print Structures
- Copy and Paste with JChem for Excel
- Convert from Structures
- Convert to Structures
- Convert ISIS, ChemDraw, Accord, and Insight for Excel Files to JChem for Excel Files
- Calculations with Third-Party Services
- Specify External Image and Name Services
- Importing from Databases in JChem for Excel
- Manage Connections
- Add an Oracle Connection in JChem for Excel
- Add a MySQL Connection in JChem for Excel
- Add an MSSQL Connection in JChem for Excel
- Add a PostgreSQL Connection in JChem for Excel
- Add a JChem Web Services Connection in JChem for Excel
- Favorite Entities in JChem for Excel
- Edit and Delete Connections in JChem for Excel
- Import from Database in JChem for Excel
- Import from IJC Database in JChem for Excel
- Import from Database by IDs
- Manage Connections
- Resolve ID
- Import from File
- Export to File
- Share Excel Files
- Co-authoring
- Save to Share
- R-group Decomposition in JChem for Excel
- SAR Table Generation
- Structure Filter
- Options in JChem for Excel
- General Options in JChem for Excel
- Database Connection Options
- Formatting Options
- Licensing Options in JChem for Excel
- File Import Options in JChem for Excel
- IJC Import Options in JChem for Excel
- File Export Options in JChem for Excel
- Printing Options in JChem for Excel
- Structure Sheet Options
- Image Conversion Options
- Structure Display Options in JChem for Excel
- Structure Editor Options in JChem for Excel
- Event Handling Options in JChem for Excel
- Actions
- Functions in JChem for Excel
- Custom Chemical Functions in JChem for Excel
- Use Custom Chemical Functions
- Functions Reference
- Normal
- Charge in JChem for Excel
- Chemical Terms in JChem for Excel
- Dissimilarity
- Drug Discovery Filtering in JChem for Excel
- Elemental Analysis in JChem for Excel
- Geometry in JChem for Excel
- Hydrogen Bond Donor-Acceptor in JChem for Excel
- Isomers in JChem for Excel
- Naming
- Protonation and Partitioning in JChem for Excel
- Solubility
- Tautomers in JChem for Excel
- Topology Analysis in JChem for Excel
- Structure in JChem for Excel
- Image
- Normal
- User Interface Customization in JChem for Excel
- Checking DirectX Information
- JChem for Office User's Guide
- JChem Ribbon
- Working with Structures
- Importing from Databases in JChem for Office
- Manage Connections in JChem for Office
- Add an Oracle Connection in JChem for Office
- Add a MySQL Connection in JChem for Office
- Add an MSSQL Connection in JChem for Office
- Add a PostgreSQL Connection in JChem for Office
- Add a JChem Web Services Connection in JChem for Office
- Favorite Entities in JChem for Office
- Edit and Delete Connections in JChem for Office
- Import from Database in JChem for Office
- Import from IJC Database
- Manage Connections in JChem for Office
- Import from File in Jchem for Office
- Options in JChem for Office
- Properties in JChem for Office
- Switching JChem for Office to Lite Mode
- JChem for Office Lite User's Guide
- JChem for Office Known Issues
- JChem for Office History of Changes
- KNIME Nodes
- Pipeline Pilot Components
- JChem for Office
- Cross Product Documentation
- ChemAxon Configuration Folder
- Chemical Fingerprints
- Chemical Terms
- File Formats
- Basic export options
- Compression and Encoding
- Document formats
- Graphics Formats
- Molecule file conversion with Molconverter
- Molecule Formats
- CML
- MDL MOL files
- Daylight SMILES related formats
- ChemAxon SMILES extensions
- IUPAC InChI, InChIKey, RInChI and RInChIKey
- Name
- Sequences - peptide, DNA, RNA
- FASTA file format
- Protein Data Bank (PDB) file format
- Tripos SYBYL MOL and MOL2 formats
- XYZ format
- Gaussian related file formats
- Markush DARC format - VMN
- CSV
- Input and Output System
- License Management
- Long Term Supported Releases - LTS
- Notice about CAS Registry Numbers®
- Public Repository
- Scientific Background
- Structure Representation
- Structure Representation - Class Representation
- Aromaticity
- Implicit, Explicit and Query Hydrogens
- Assigning stereochemistry descriptors
- Cleaning options
- Deprecated and Removed Methods
- Relative configuration of tetrahedral stereo centers
- Iterator Factory
- Atom and bond-set handling
- Graphic object handling
- Supported Java Versions
- Legal
- Legal Documents
- Cookie Policy
- End User License Agreement
- End User Subscription Agreement - EUSA
- Personal Data Management - General
- Personal Data Management - Newsletter Subscriptions
- Privacy Policy
- Privacy Policy for ChemAxon Synergy
- Terms of Use
- Terms and Conditions for UX Research Program
- Notice for ChemAxon Software User Experience (UX) Research
- Recording Policy
- White Papers
- Legal Documents
- Discontinued Products
- Document to Database
- Fragmenter
- JChem Neo4j Cartridge
- Markush Overlap
- MarvinSpace
- MarvinSpace User's Guide
- MarvinSpace Developer's Guide
- MarvinSpace History of Changes
- Metabolizer
- Plexus Suite
- Quick Start Guide - Plexus Suite
- Plexus Suite User Guide
- Log in to Plexus Suite
- The Plexus Suite Dashboard
- Importing New Data
- Exporting Your Data
- Browsing in Your Data Set
- Selecting Data
- Searching in Your Database
- Saved Queries
- List Management
- Sorting Data
- Sharing Data with Other Users
- Calculating Molecular Properties for Single Compounds
- Adding calculated columns to tables
- Scaffold Based Enumeration
- Reaction Based Enumeration
- Registering Molecules in the Corporate Database
- Charts view
- Plexus Suite Video Tutorials
- Plexus Suite Administrator Guide
- Plexus Suite Authentication
- Sharing Schema Items Among Users
- Business Flags
- Row-level Security
- Building blocks
- Admin Tools
- Adding JavaScript Files for Custom Functionality
- Writing JavaScript Files for Custom Functionality
- Integration with ChemAxon's Compound Registration System
- Shared data sources in Plexus Connect
- Configuration Files
- Edit Views
- Simple table
- Installation and System Requirements of Plexus Suite
- Plexus Suite Licensing
- Getting Help and Support for Plexus Suite
- Plexus Suite FAQ
- Plexus Suite Privacy Policy
- Terms of Use for the Plexus Suite Demo Site
- Plexus Suite History of Changes
- Schema Refresh Without Restart
Validation results
The following page contains validation results for some of ChemAxon's calculator plugins:
pKa validation results
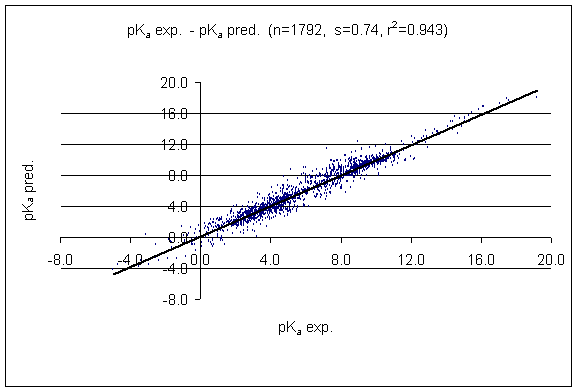
Fig. 1 Predicted vs. experimental results of the pKa calculation
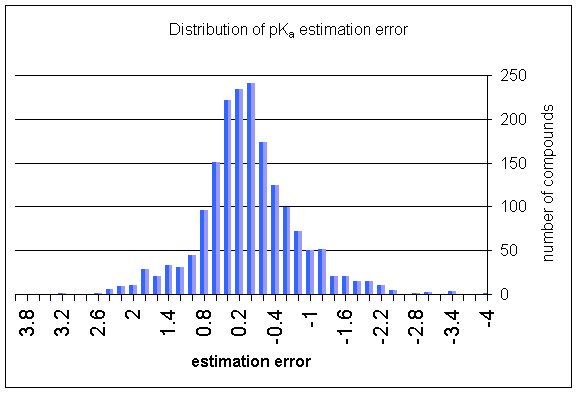
Fig. 2 Distribution of the pKa estimation error
{info} A study comparing various p K a calculation results versus the measured p K a values of compounds was published by John Manchester et al. Read the article here.
logP validation results
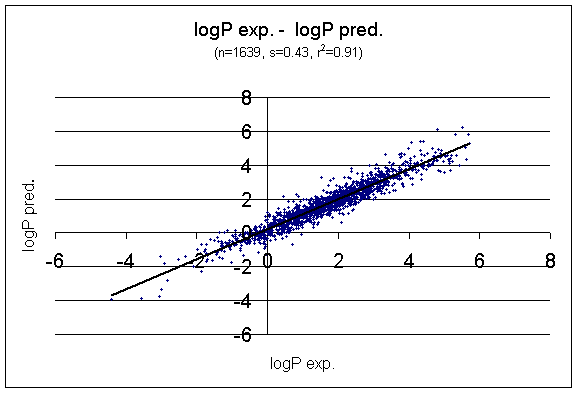
Fig. 3 Predicted vs. experimental results of the log P calculation
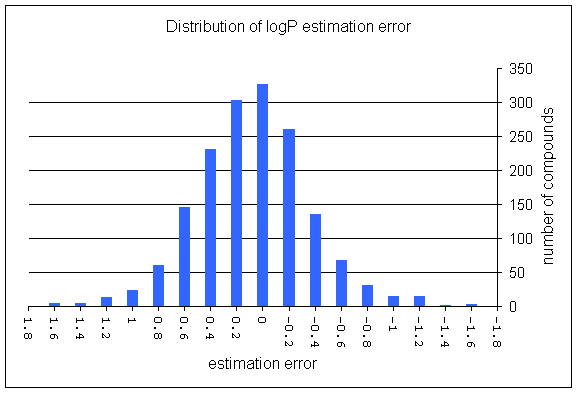
Fig. 4 Distribution of the log P estimation error
Average molecular polarizability validation results
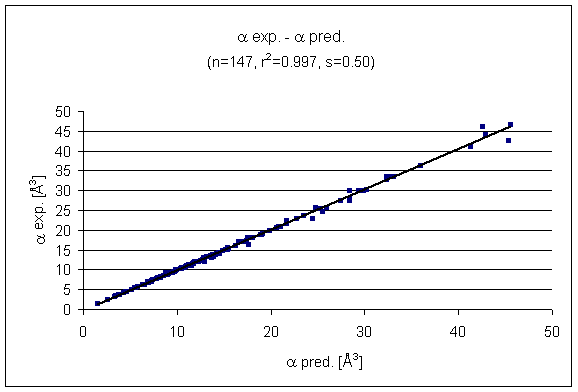
Fig. 5 Predictied vs. experimental results of the polarizability prediction
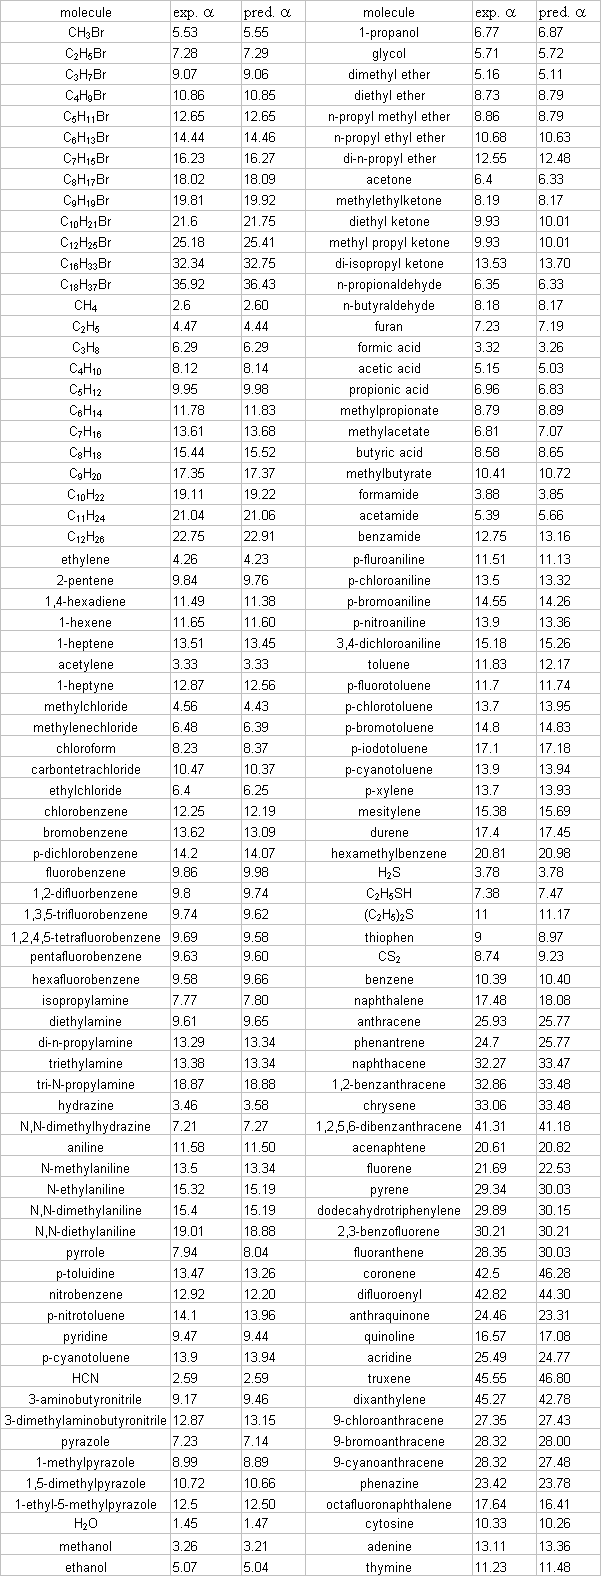
Table 1. Experimental vs predicted values
3D molecular polarizability validation results
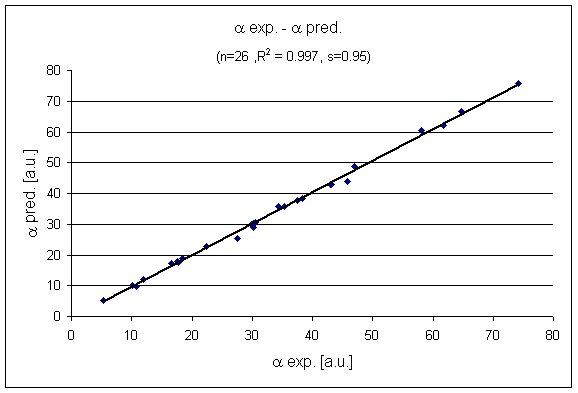
Fig. 6 Predicted vs. experimental 3D molecular polarizability values
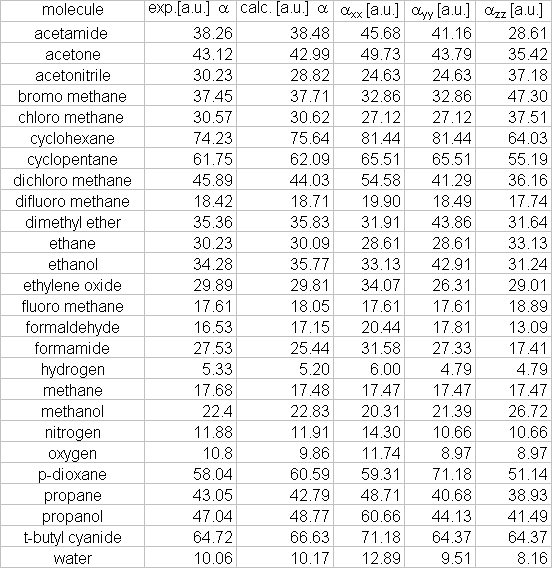
Table 2. Experimental 3D polarizability values