Instant JChem Plugins for Canvas Widget
This guide provides step-by-step instructions for installing IJC plugins for Canvas Widget and illustrates their use through practical examples.
Introduction
The Canvas Widget is a powerful tool for dynamic data visualization, turning numbers and texts into interactive graphs, diagrams, and other easy-to-read graphics. It's a great helper in instrumental analysis, allowing you to individually pick, parameter-select (e.g. selecting the top 5 peaks), zoom, modify or compare data points and much more. Accessible in both grid and form views, the Canvas Widget provides the convenience of analyzing all your data on a single screen.
The following examples provide just a quick glimpse into the Canvas Widget's capabilities. If this tool catches your eye, check out the IJC plugin quickstart guide to build your own plugins.
Should you require a solution precisely tailored to your specific needs, the Instant JChem support team is ready to assist. Contact us via Chemaxon Freshdesk for custom-designed plugins.
Installing Plugins
-
Exemplary plugins are located on the Instant JChem download page.
-
On the aforementioned page, the
Browse previous versionsoption provides access to various version selections. -
Choose the desired version and download
ijc-api-examples.zipfile located inside the version folder. -
Once the
ijc-api-examples.zipfile has been downloaded, extract the contents. -
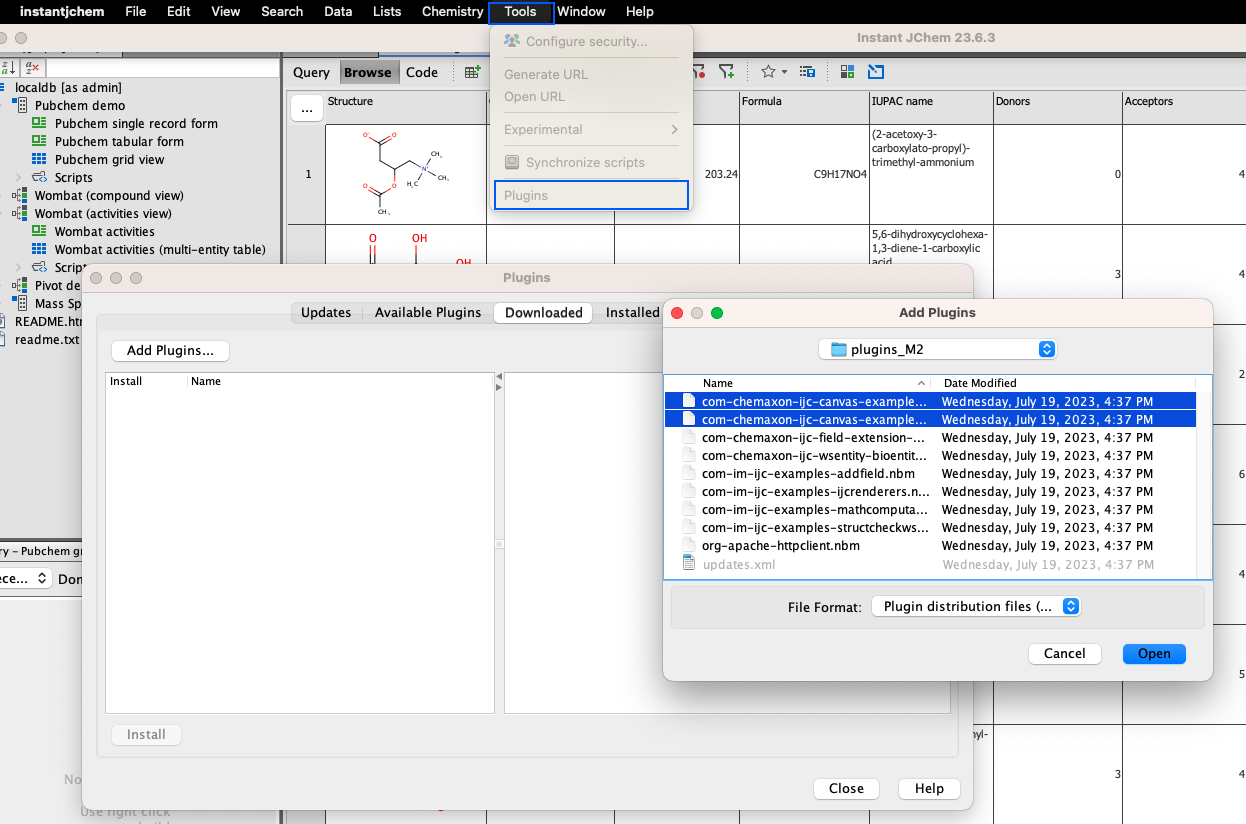
After launching Instant JChem (IJC), click Tools > Plugins option in the Main menu to open plugin interface.
-
In the newly displayed window, choose
Downloadedtab and clickAdd Plugins.... -
Navigate to the
pluginsfolder found within the previously extracted ijc-api-examples directory. -
Once here, select
com.chemaxon.ijc.canvas.examples.ringsandcom.chemaxon.ijc.canvas.examples.demoplugins and click install.
Upon successful installation, the plugins will be ready-to-use in both grid and form views.
The demo plugin contains renderers for Boolean and datetime fields.
com.chemaxon.ijc.canvas.examples.demo.BooleanCellis designed to present a graphical designs into Boolean field.
com.chemaxon.ijc.canvas.examples.demo.ClockCellis designed to present a graphical designs into datetime field.
The rings-plugin contains renderer for calculated field.
com.chemaxon.ijc.canvas.examples.rings.RingsCellis designed to present grap for a calculated field
com.chemaxon.ijc.canvas.examples.rings.RingsWidget- for a Form view Canvas widget.
Be aware that the .RingsCell class is utilized in Grid view, while the .RingsWidget class is employed in Form view. This applies to all previously mentioned handler classes.
Examples
Example 1: Custom Drawing in Boolean Field
Leveraging graphical elements for Boolean fields in IJC's grid view offers multiple benefits. Not only it enhances the interface's visual appeal, but also simplifies the process of data analysis. Collectively, the employment of visual elements contributes to a more intuitive and efficient user experience while scanning through the datasets
-
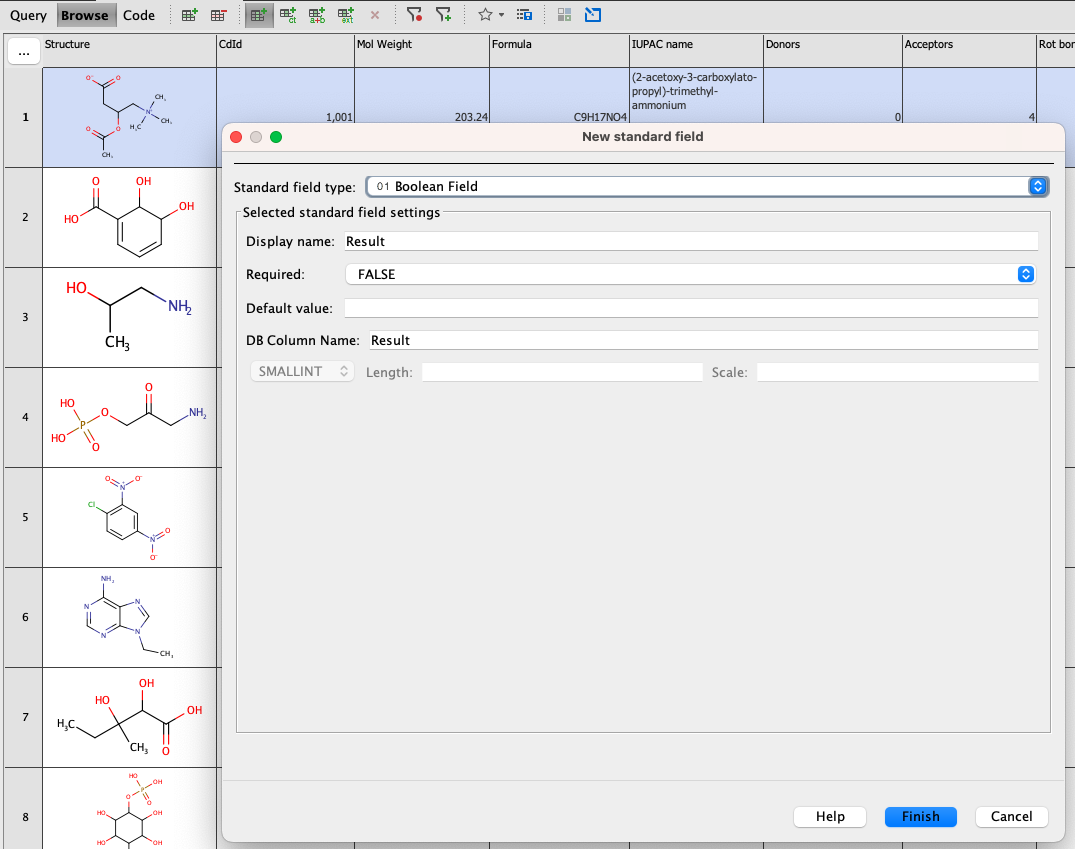
Create a new Boolean field in a grid view.
-
Fill in a few checks and crosses by clicking into the empty cells (this is solely for observing the changes that occur after implementing the Canvas renderer). Right click on the field and choose Customize Widget Settings.
-
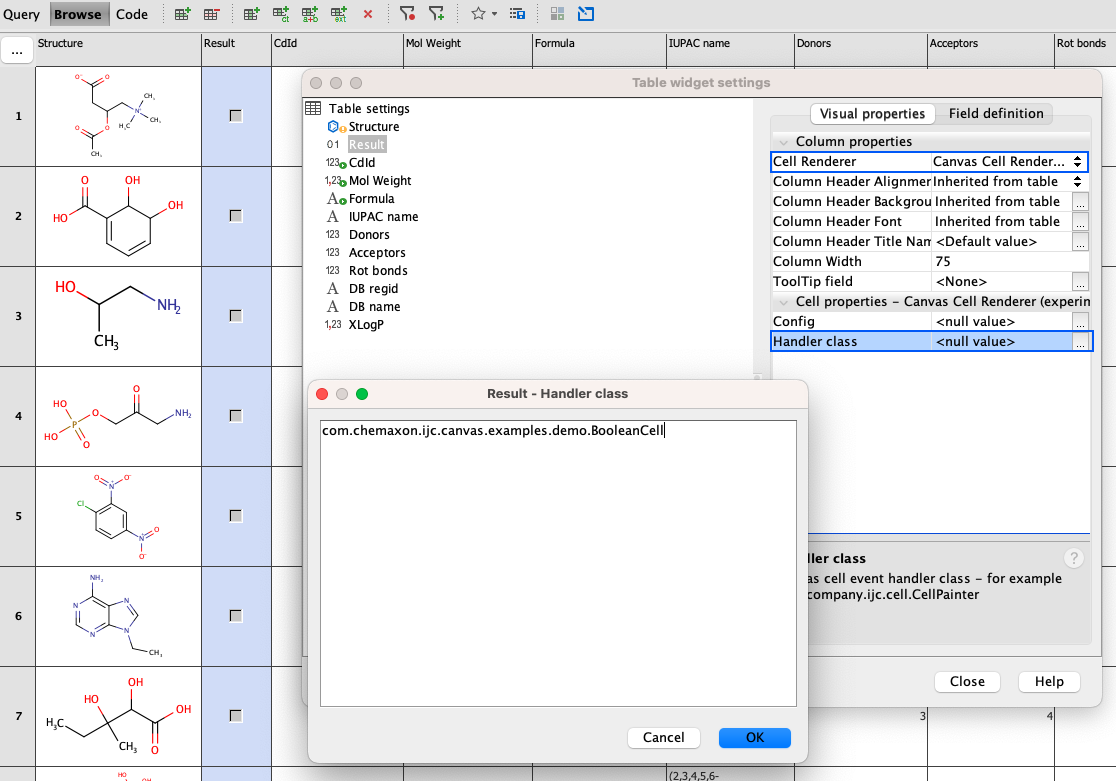
Change
Cell Renderer:option toCanvas cell renderer. Paste the following handlercom.chemaxon.ijc.canvas.examples.demo.BooleanCellinto Handler class. Close the Table Widget Settings wizard.
-
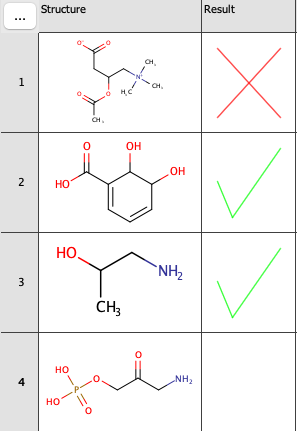
The Boolean field value is now displayed as an image.
-
Various graphic elements (e.g. a green check mark for “true”, a red “x” for “false”) can be used for displaying the Boolean field value. Their shape, colour and size can be easily changed by using a JSON map in the Config field.
Example 2: Custom Drawing in Datetime Field
-
Create new date field and fill in few random dates.
-
Right click on the field and choose Customize Widget Settings. Change
Cell Renderer:option toCanvas cell renderer. -
Enter
com.chemaxon.ijc.canvas.examples.demo.ClockCellinto Handler class, as in previous example, click OK and close the Customize Widget Settings wizard. -
Date time is now displayed as clocks.
Example 3: Displaying Parent-Child Entity Relations
For a clearer understanding of the following example, it would be helpful to have a foundational knowledge of parent-child entity relations. Please refer to the Pivoting tutorial for a comprehensive guide on establishing such relationships.
Suppose we want to visually display results from a random experiment conducted on every structure in the dataset three times. With each repetition, the concentration was elevated (for instance, 50mM, 100mM, and 200mM). In simpler terms, each molecule is associated with three measurement outcomes we wish to display.
Visualization in Grid View uUing Canvas Cell Renderer
-
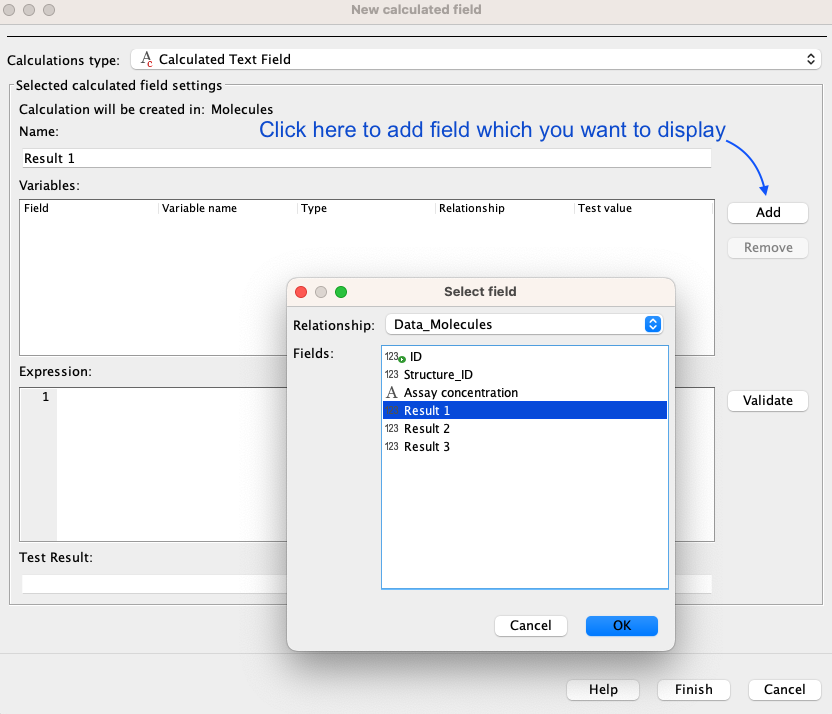
Create New Calculated field as
Calculated text fieldtype. -
Choose name for the new field.
-
Click
Add. In the child entity, select the field you wish to display. For our demonstration, we're aiming to show the values in theResult 1field. Confirm by clicking OK.
-
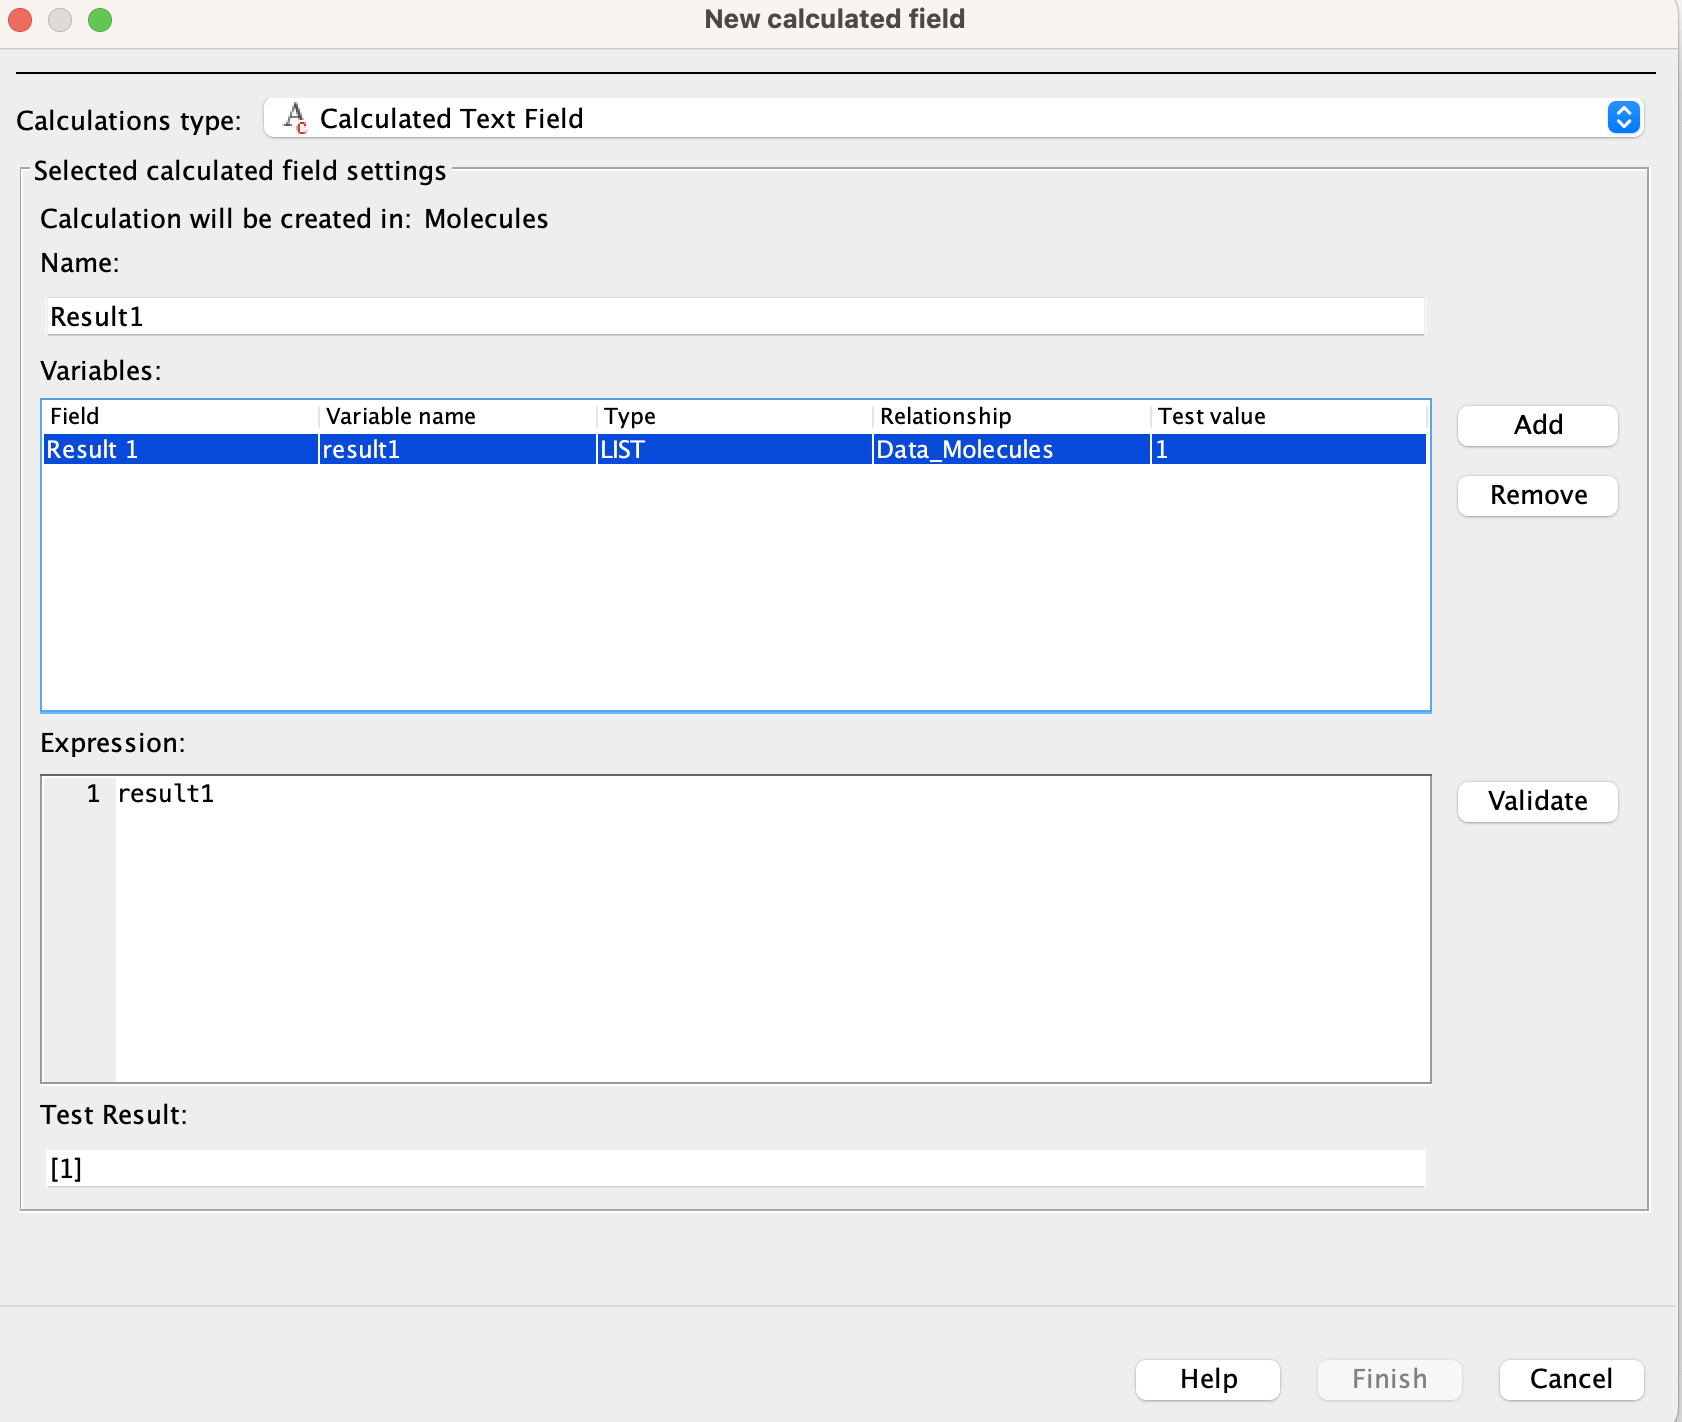
Set the variable Type to
List. This configuration ensures that all three result values are enumerated. -
Enter the
Variable nameasExpressionand clickValidate. You should see[1]as aTest Result.
-
Click Finish. The values in the field are now visible in [x1,x2,x3] format.
-
Open Customize Widget Settings and switch to
Canvas cell renderer. -
Open Handler Class and copy paste
com.chemaxon.ijc.canvas.examples.rings.RingsCell. Click OK and close Widget settings. -
The values in the field Result 1 are now displayed as rings. Diameters of the rings
are proportional to the measured values. The bigger the value, the bigger the ring. For higher values, it may be necessary to zoom out to see the corresponding ring.
Visualization in Form View Using Canvas Widget
-
To visualize the rings in a form view, we need to use Wombat data tree since the
com.chemaxon.ijc.canvas.examples.rings.RingsWidgetserves solely as an example and is designed specifically for Wombat data tree. -
Open Wombat data tree and select
Wombat(compound view) compounds. -
Once there, switch to the design mode and drag and drop Canvas Widget from the sidebar to any empty place in the form.
-
Right click on the widget and select Customize Widget Settings. Fill in the handler class
com.chemaxon.ijc.canvas.examples.rings.RingsWidget, click OK and close the widget settings. -
The rings are now visible. In the form view, the widget is interactive and can be modified as pleased.
Links to Related Documentation
- For a brief overview of Canvas widget in Instant JChem click here.
- For additional Canvas widget examples click here.
- Interested in building your own plugins? Click here.
Summary
In conclusion, the Canvas Widget stands as a potent tool for dynamic data visualization, transforming numerical and textual data into interactive and easily interpretable graphics. This capability significantly enhances workflow, allowing users to selectively analyze, modify, or compare data. By incorporating plugins, one can tailor the visualizations to specific needs, whether it's displaying spectra or graphs of any kind or complex parent-child entity relations.