Plexus Connect Supports Jupyter Notebook
This documentation aims to highlight benefits of using Plexus Connect together with Jupyter Notebook and to provide practical examples of their combined use.
Introduction
Jupyter Notebook, a popular web-based application, is widely used in both academic and business settings for creating and sharing documents that blend live code, text, and data visualizations. With Plexus Connect's integration of Jupyter Notebook, your chemical data can be effortlessly transferred in real time, allowing for seamless incorporation into your team's projects.
Here are just a few advantages of using Plexus Connect with Jupyter Notebook:
- Interactive Data Analysis: Execute live code, manage computations, and analyze data seamlessly.
- Spectroscopy Data: Effortlessly handle and analyze spectroscopy data, alongside other datasets.
- Visual Insights: Utilize Python and its libraries to create visualizations that reveal underlying patterns and trends.
- Collaborate and Communicate: Combine code, visuals, and text in a single document to share insights with your team.
- Customizable Workflows: Adapt your data processing, analysis, and visualization to fit your project needs.
Requirements and Setup
-
Python Installation on local system. Version 3.7 or higher. Also, following python libraries need to be installed. They can all be installed directly from command prompt via pip3 install
, e.g. pip3 install seaborn. - matplotlib
- seaborn
- numpy
- pandas
- pillow
- Connect API extension for local Python.
- Jupyter Notebook, which can be installed directly from command prompt by
pip3 install jupyteror by using Anaconda and conda. For detailed description of the installation, navigate to Jupyter Website.
-
Following Downloadables
- Plexus Connect sample project downloadable here.
- corresponding ijs file downloadable here. In the ijs file, fill in
<entry key="database.url">so that it leads to the sample project.
- Jupyter Notebook file downloadable here.
Examples of Usage
Example 1: Constructing Chart in Jupyter From Data in Connect
-
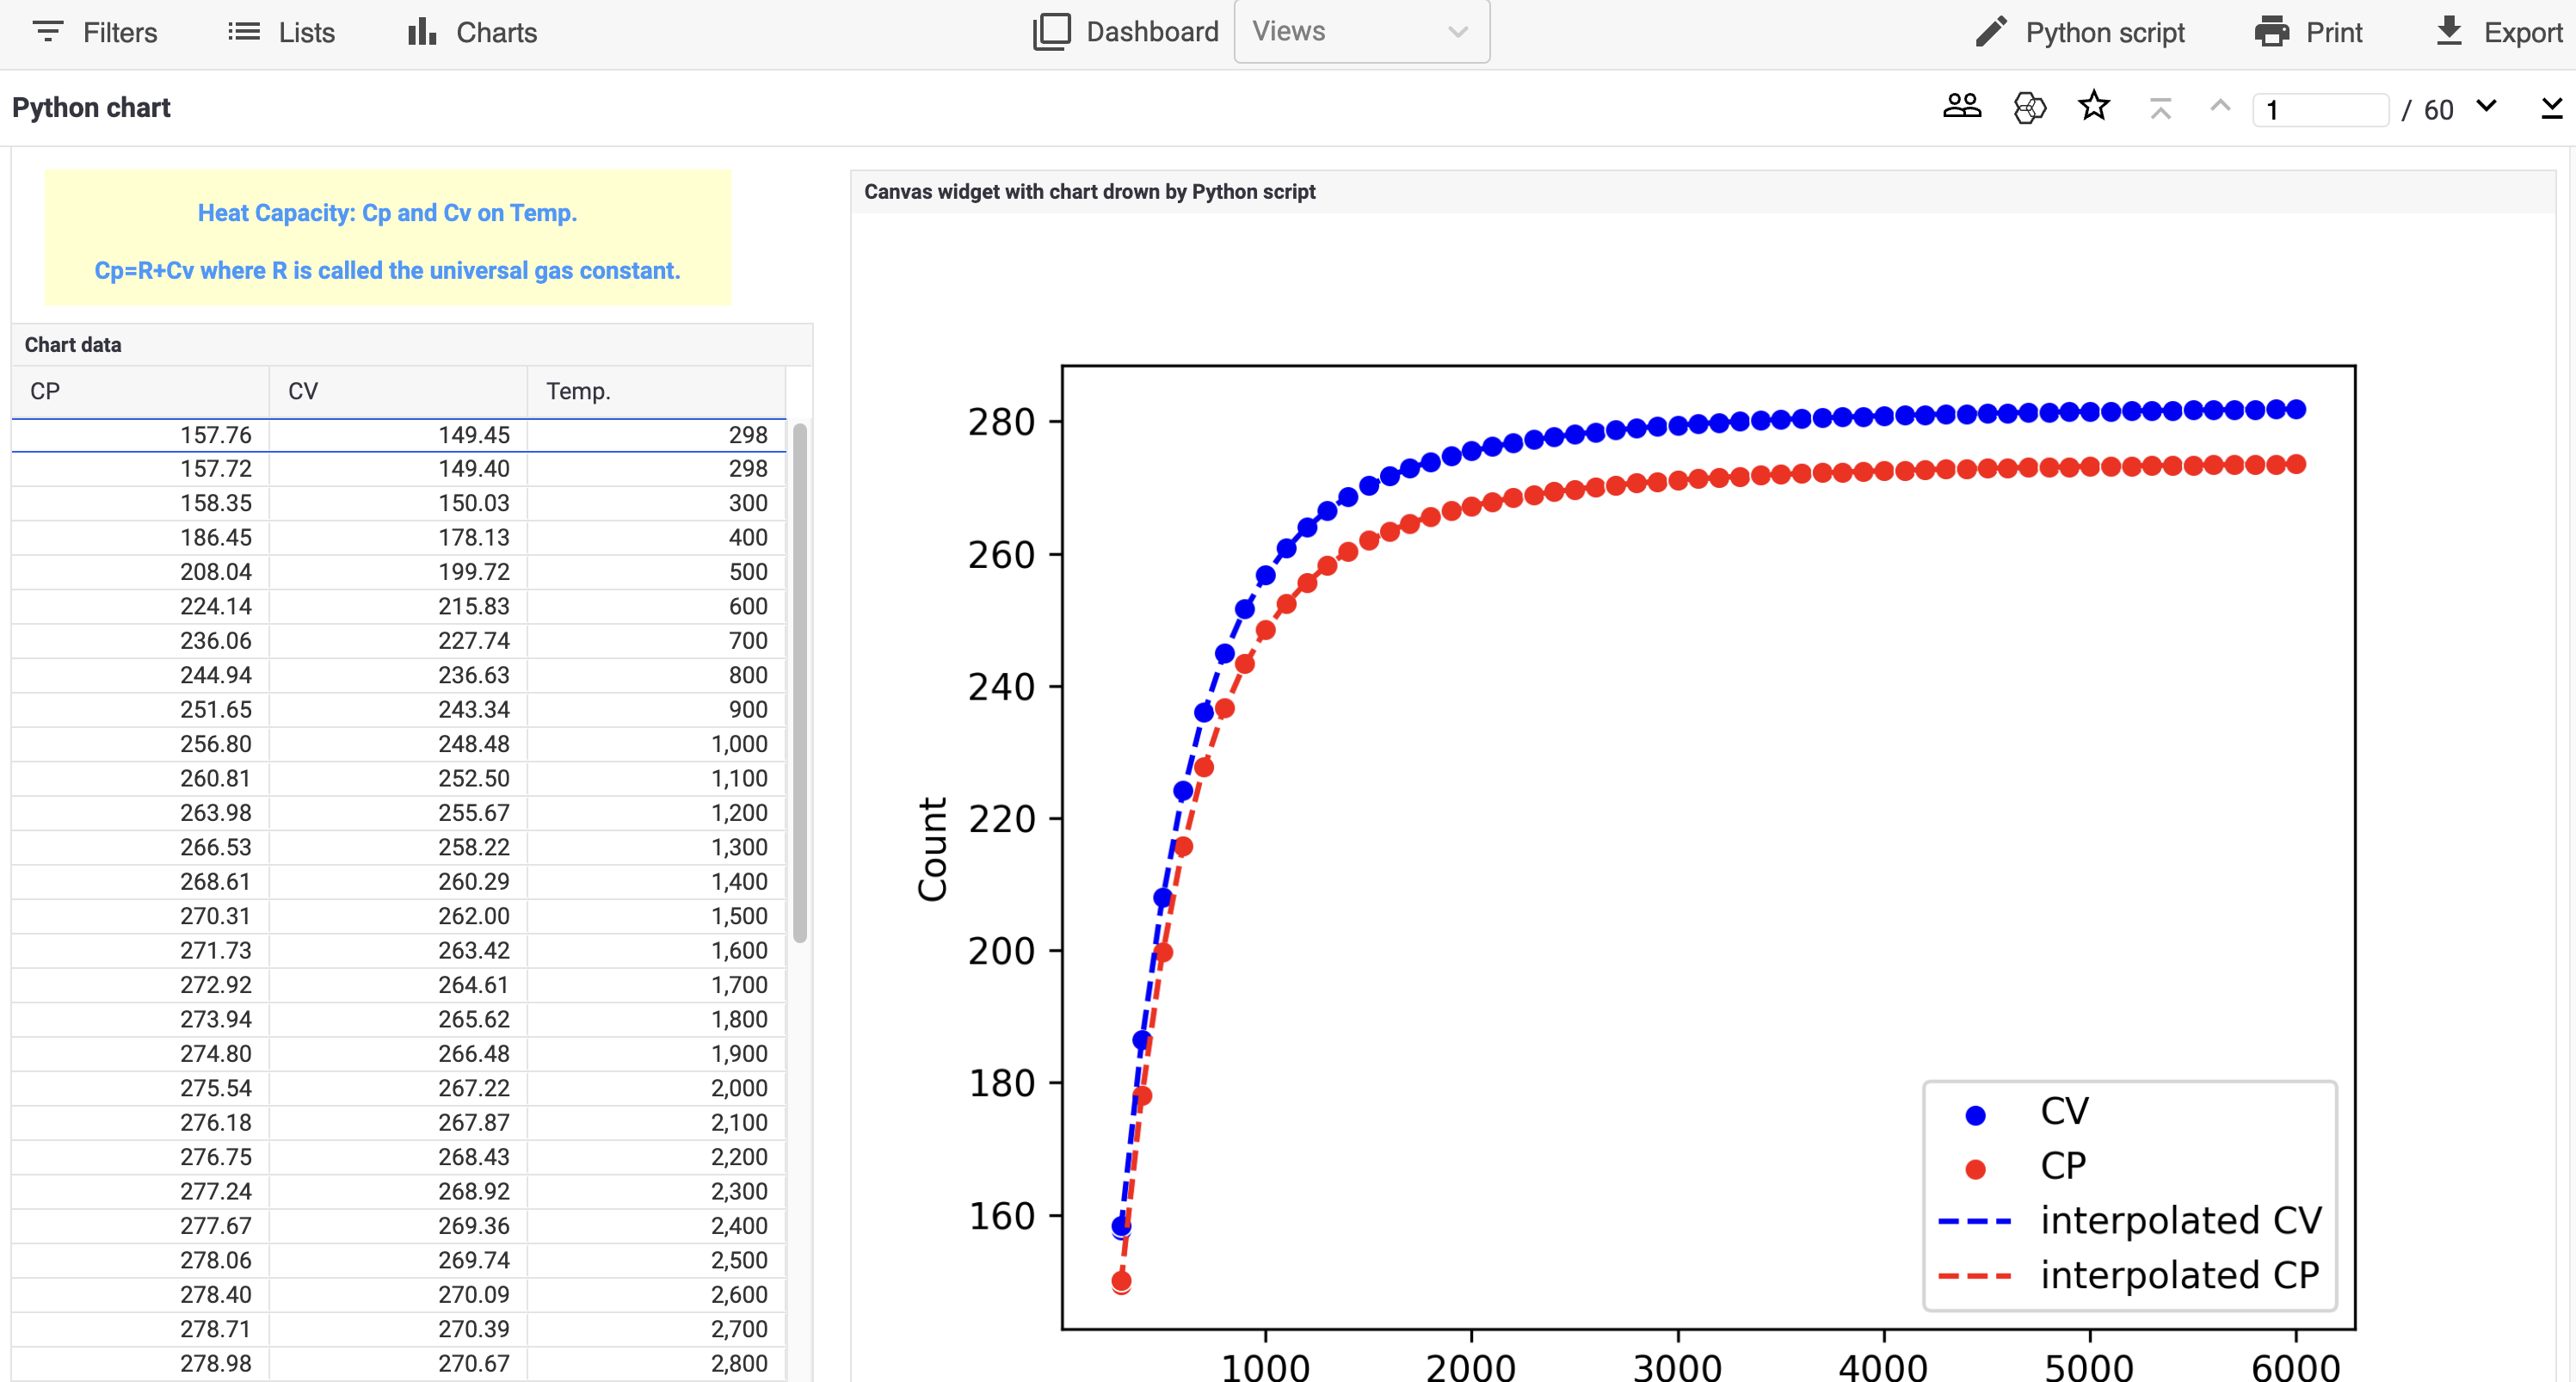
Start Plexus Connect and open
Python ChartView to access the data which are going to be used in the Example. You will see the data and a chart generated from the data. The goal is to construct the same chart directly in Jupyter Notebook.
-
Open the command prompt on your computer and change the directory to the location where you've saved the Jupyter Notebook file you previously downloaded.
-
Type the command
jupyter notebookinto the command prompt and press enter. This will open a browser window showing the contents of the folder from which you've launched Jupyter Notebook. -
Open the file you downloaded. Copy your API Key in the place of
in the first code snippet. See the documentation here for guidance where to find you Connect API key. -
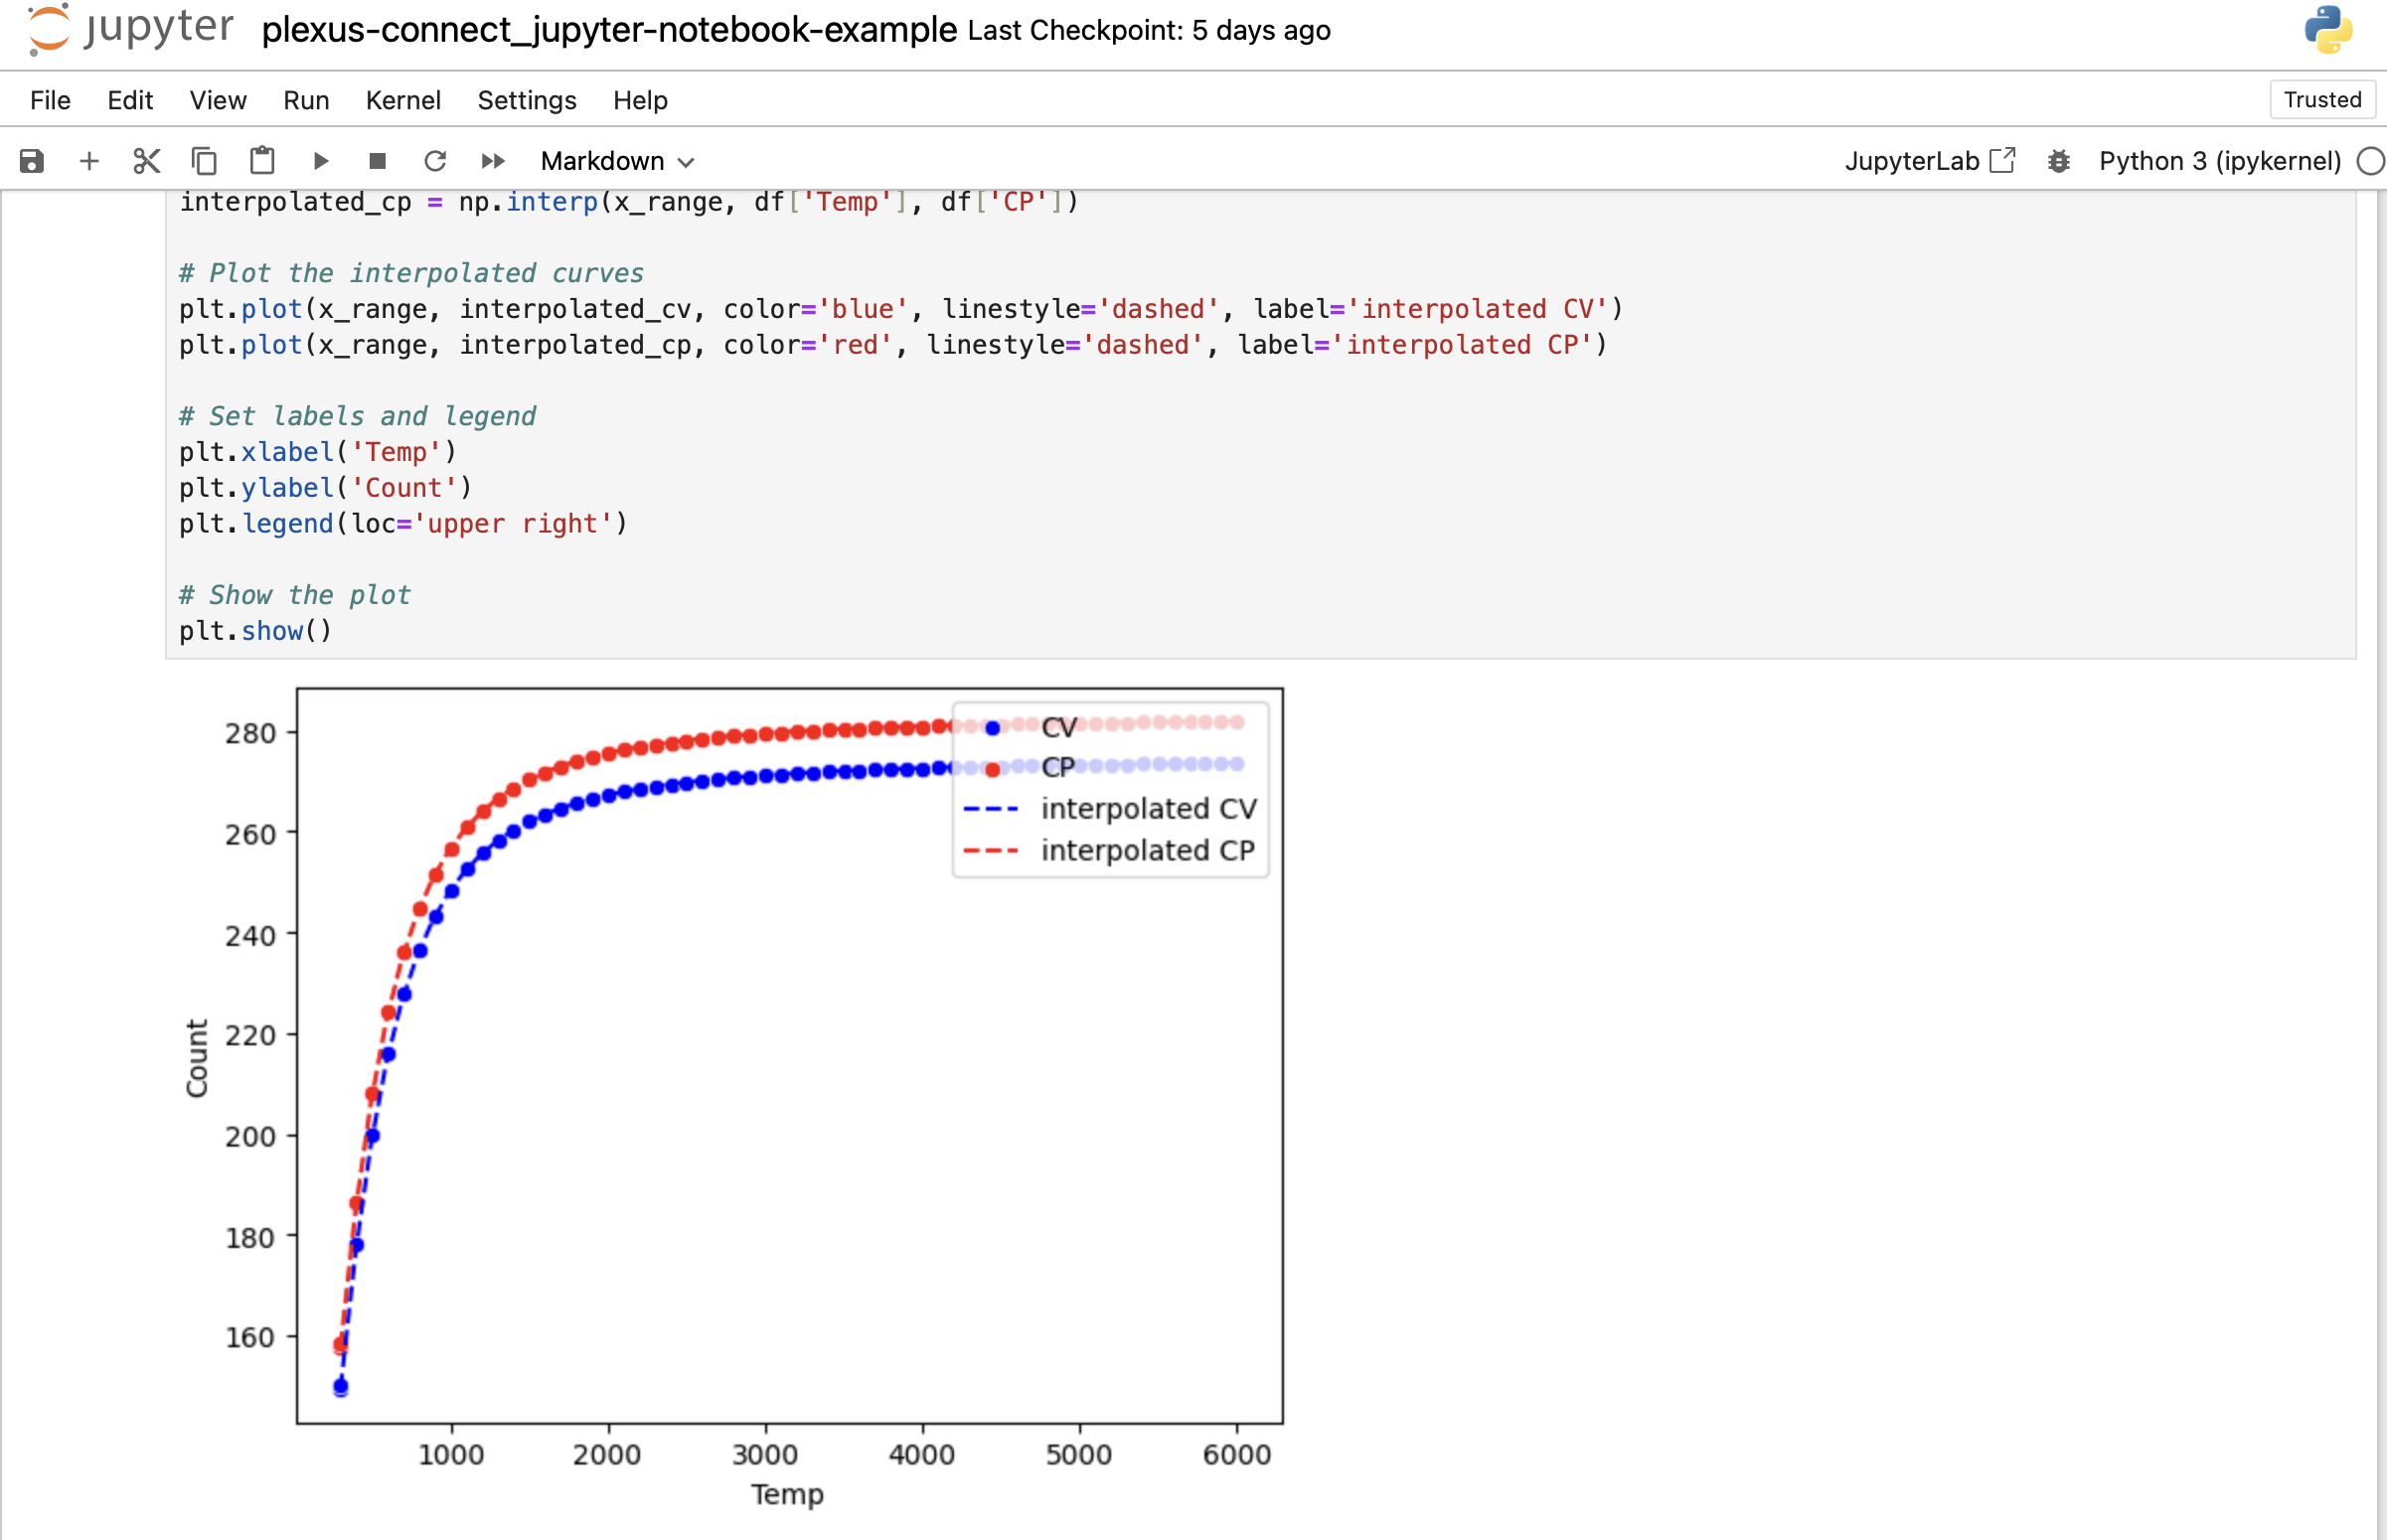
In order to create the chart, execute the code snippets one by one. Each code snippet includes a detailed description of its function. Once you execute all code snippers, the chart will be constructed.
Example 2: Advanced Usage
Example 2 can be found on the separate page here
Should you require a solution precisely tailored to your specific needs, the Instant JChem support team is ready to assist. Contact us via Chemaxon Freshdesk.